
If you want to show the ranking in a Power BI visual, one way is to use a visual that supports that, such as a Ribbon chart. Another way, which is a more common way, is to write a calculation for rank, and RANKX is a DAX function that can help you with that. In this article and video, I explain how that works.
Video
RANKX DAX Function, How does it work?
RANKX is a Scalar function in DAX, it means it just returns one value. It cannot be used directly to create a table, unless it is combined with tabular functions.
RANKX provides the rank as a number based on an expression, here is the syntax of using this function:
RANKX(<table>, <expression>[, <value>[, <order>[, <ties>]]]) The table and expression are the required parameters, the rest are optional.
- Table: The table (or virtual table) that is used as the source of items for the ranking.
- Expression: The expression that the ranking is calculated based on it. This DAX expression should return a single scalar value.
- value (optional); scalar expression (this requires a post of its own, and I may explain it separately)
- order(optional); Based on what order the ranking is calculated. default is descending.
- ties(optional); What should happen if there is a tie
Using RANKX as a Measure
If you are interested to use RANKX as a column, read this article. If you want to use it in a measure (which is normally when you want the ranking to be calculated dynamically), there is a little trick.
Let’s assume we want to have the ranking in the visual below based on the Sales measure (which is Sum(FactInternetSales[SalesAmount]).

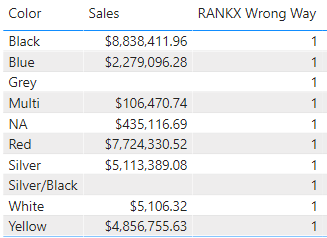
If you use RANKX as below, it is not going to work as expected;
RANKX Wrong Way =
RANKX(
    DimProduct,
    [Sales])
Color is a field in DimProduct, and you may think the table parameter of the RANKX should be DimProduct, but that leads to all ranks to be calculated as 1!
Even if you change the table to FactInternetSales, you will get the same result. The reason is that RANKX will evaluate the rank based on the values generated for the table parameter. The table parameter still takes the visual filter into the consideration.
The TABLE matters
When the visual is filtered by color, the table will be already filtered by that color, and the rank of the color in that single color is always one! To get around this, the trick is to run the expression for all values, and that is where a function similar to ALL can be helpful.
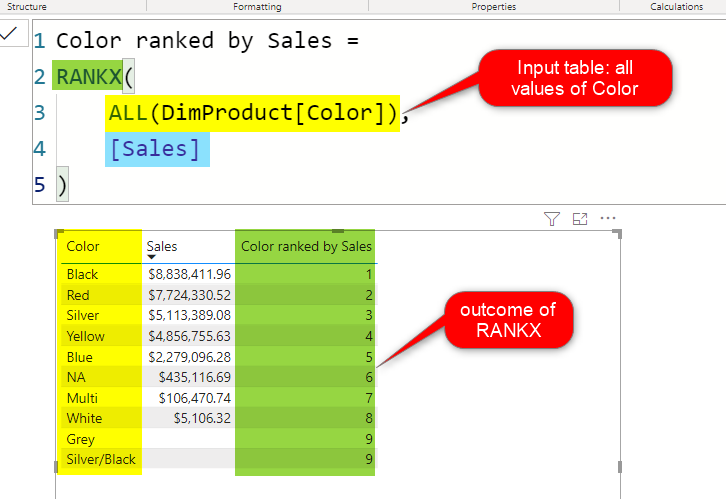
The correct way of calculating the rank in a visual that we want to rank it based on the color is to do it for all of that Color column;
Color ranked by Sales =
RANKX(
    ALL(DimProduct[Color]),
    [Sales]
)
This would generate the correct ranking as below;
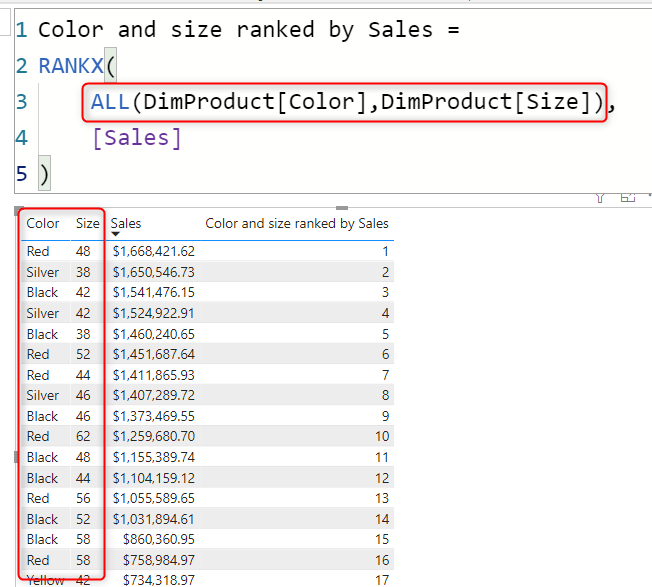
If you want to show the ranking on a visual with more than one column, then your table parameter should include that too;
Color and size ranked by Sales =
RANKX(
    ALL(DimProduct[Color],DimProduct[Size]),
    [Sales]
)
Here is the result;
The above works if the two columns are from one table of course, if the two columns are from different tables, you will get an error as below;
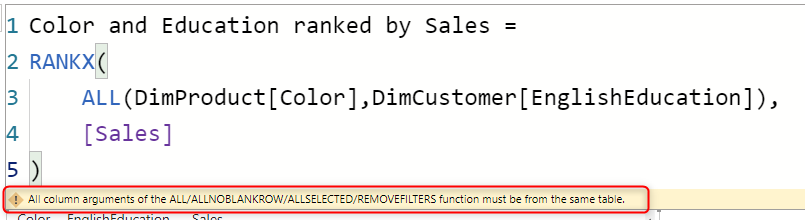
In a case like this, you can use a function that creates a table of the combination, something like CrossJoin.
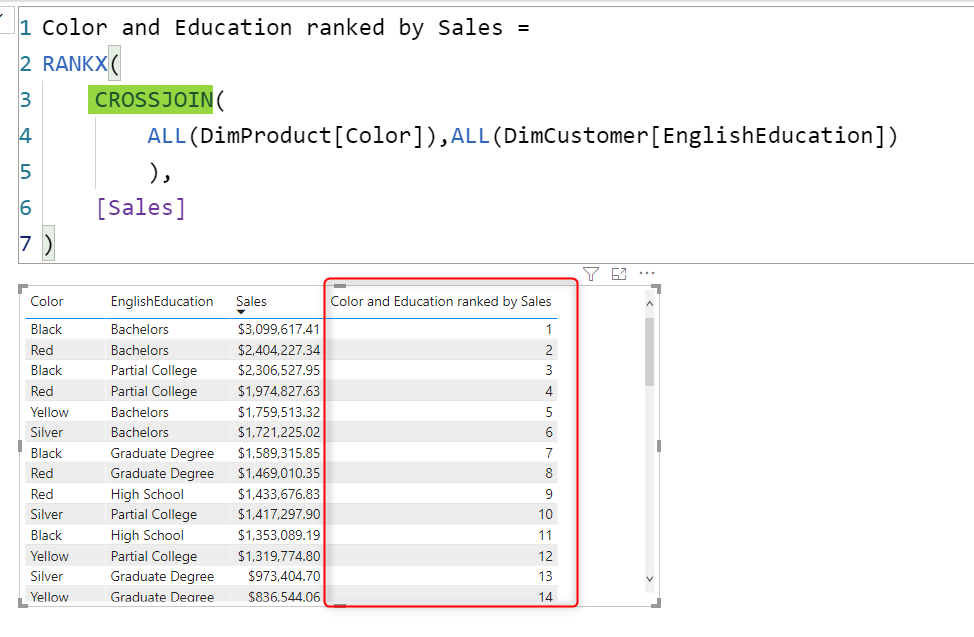
Color and Education ranked by Sales =
RANKX(
    CROSSJOIN(
        ALL(DimProduct[Color]),ALL(DimCustomer[EnglishEducation])
        ),
    [Sales]
)
CrossJoin is of course, not the only way to produce this result, it is just one way of doing it.
Think of all tabular functions when you want to write the table parameter here. They can be mostly helpful.
Dealing with TIES
An important consideration when you are doing the ranking is what happens when there is a tie?
TIE is when two values in the table generates exactly the same number as the expression, and will end with the same rank too. Below is an example of TIE;
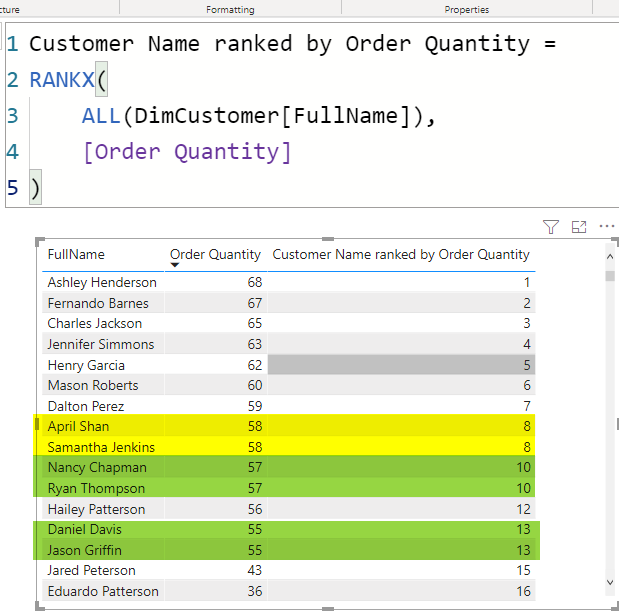
When there is a tie, the rank for both items would be the same (example; 8, 10, or 13 in the above). But you can choose what the next rank is going to be.
SKIP
This means if there is a tie, (for example, two items with the rank of 10), the next rank value would skip these ranks and start from 12 (10+2(number of ties)). This option is the default tie condition. and it is what you see already in above as a result.
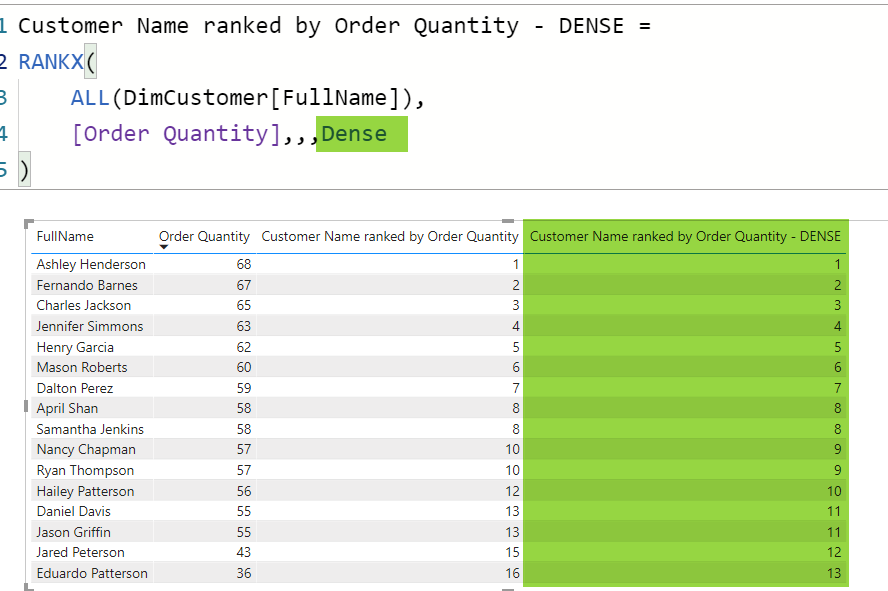
DENSE
This means if there is a tie, (for example, two items with the rank of 10), the next rank value would start from the next rank regardless of the tie, and would be 11. Here is an example result of ranking with dense tie condition;
Customer Name ranked by Order Quantity - DENSE =
RANKX(
    ALL(DimCustomer[FullName]),
    [Order Quantity],,,Dense
)
and the result is showed here;
Summary
RANKX is a scalar DAX function in Power BI, which can be very helpful when calculating rank as a value in a Power BI visual. The important consideration for ranking is to pass the table parameter value correctly. You can also choose what happens when there is a tie.
Download Sample Power BI File
Download the sample Power BI report here:
Read more about RANKX?
If you like to learn more about the RANKX function, read the articles below;


Reza is author of more than 14 books on Microsoft Business Intelligence, most of these books are published under Power BI category. Among these are books such as Power BI DAX Simplified, Pro Power BI Architecture, Power BI from Rookie to Rock Star, Power Query books series, Row-Level Security in Power BI and etc.
He is an International Speaker in Microsoft Ignite, Microsoft Business Applications Summit, Data Insight Summit, PASS Summit, SQL Saturday and SQL user groups. And He is a Microsoft Certified Trainer.
Reza’s passion is to help you find the best data solution, he is Data enthusiast.
His articles on different aspects of technologies, especially on MS BI, can be found on his blog: https://radacad.com/blog.
Yes I am looking this article and I finally found it. I read lots of articles and watched lots of video since yesterday but I do not find the simple solution. All were confusing code. Thank you so much for explaining in simple words. Best Wishes Nishant Chandravanshi 🙂
I am glad it helped Nishant 🙂
Thank You for blog. I’m learning so much from your blogs than watching Videos. Already read 70+ Blogs.
Excellent explanation, now I understood the logic and how to use rankx. Thanks
This is the best article on rankx I could found online.
Thanks Lee