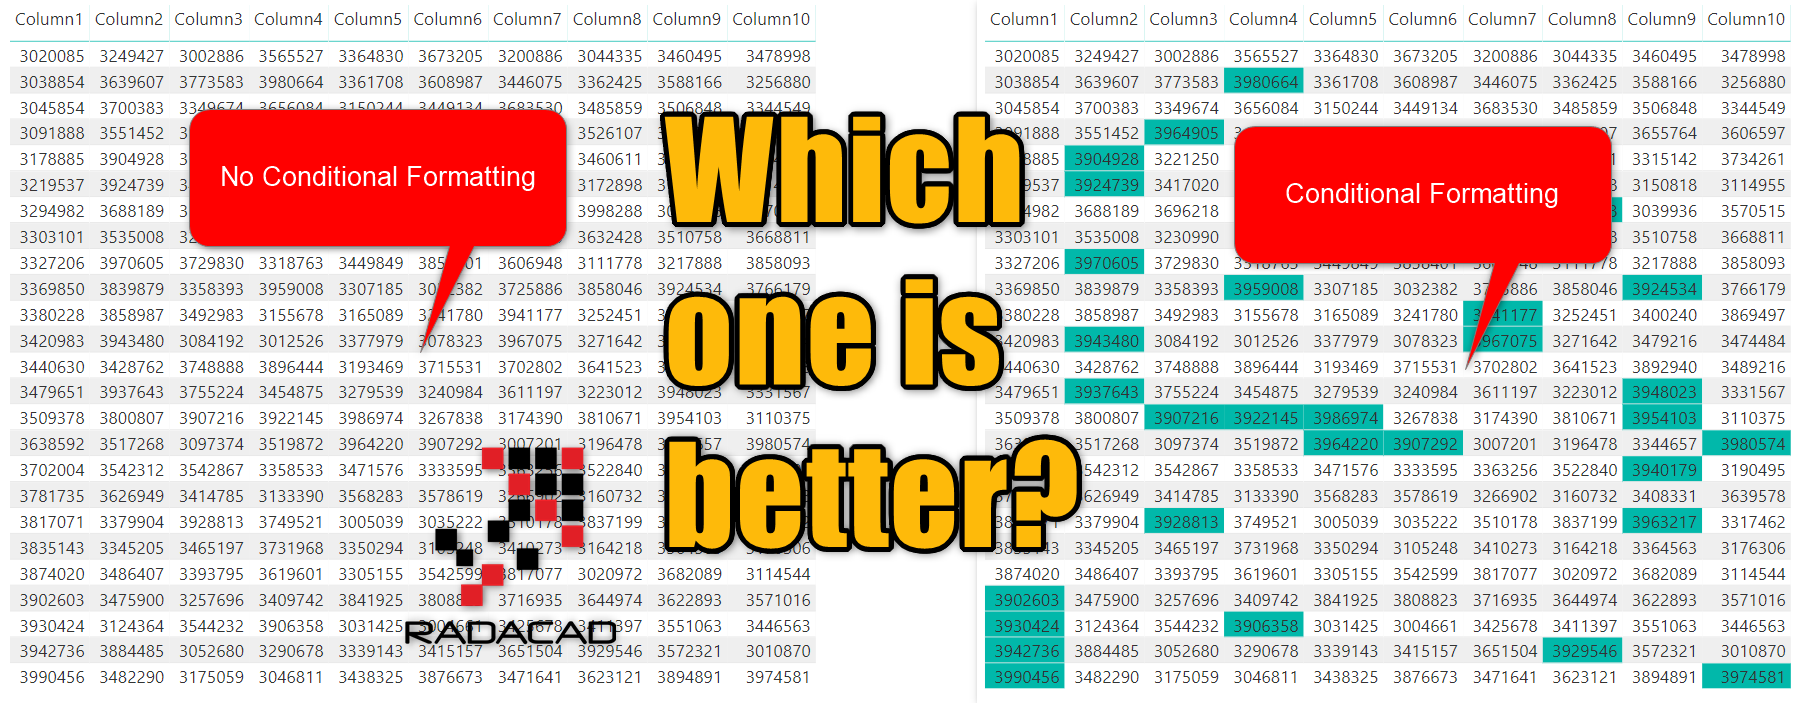
Multiple Layers of Aggregations in Power BI; Model Responds Even Faster

Aggregations are speeding up the model. However, the aggregated table is not just one table; It can be multiple layers of aggregations. Aggregation by Date, aggregation by Date and Product, aggregation by Date and Product and Customer. Multiple layers ensure that you always have the best performance result possible, and you only query the DirectQuery Read more about Multiple Layers of Aggregations in Power BI; Model Responds Even Faster[…]

Dual Storage Mode; The Most Important Configuration for Aggregations! Step 2 Power BI Aggregations

An aggregated table can be a layer on the source DirectQuery table. This table needs to have a proper relationship set up with other tables and also the proper storage mode configuration. Storage Mode configuration of the composite model is an important configuration and critical part of setting up the aggregation. The storage mode configuration Read more about Dual Storage Mode; The Most Important Configuration for Aggregations! Step 2 Power BI Aggregations[…]

Power BI Aggregation: Step 1 Create the Aggregated Table

Aggregation tables are the fast-performing solution for huge DirectQuery tables in Power BI. In the previous blog post, I explained what aggregation is and why it is an important part of a Power BI implementation. Aggregations are part of the Composite model in Power BI. Your first step for the aggregation set up is creating Read more about Power BI Aggregation: Step 1 Create the Aggregated Table[…]

Exception Reporting in Power BI: Catch the Error Rows in Power Query

To build a robust BI system, you need to cater for errors and handle errors carefully. If you build a reporting solution that the refresh of that fails everytime an error occurs, it is not a robust system. Errors can happen by many reasons, In this post, I’ll show you a way to catch potential Read more about Exception Reporting in Power BI: Catch the Error Rows in Power Query[…]

Quick Measures in Power BI: You don’t have to write DAX!?

You read it right, you don’t have to write DAX. If you are calculating a year to date, running total, or every rolling average, you may be able to do it without writing a single line of DAX code. How this is possible? With Quick Measures. Quick measures are an easy way to create DAX Read more about Quick Measures in Power BI: You don’t have to write DAX!?[…]

SUM vs SUMX; What is the Difference of the two DAX Functions in Power BI?

Sum and Sumx are functions that often founded to be misleading for many Power BI users. As both functions are doing the aggregation, it seems a bit confusing what is the actual difference between these two. There are many blog posts and articles about each function. I always explain the difference with simple demos in Read more about SUM vs SUMX; What is the Difference of the two DAX Functions in Power BI?[…]

UseRelationship or Role-Playing Dimension; Dealing with Inactive Relationships in Power BI

In a Power BI model, relationships are important for passing filters, filter propagates through relationships. However, sometimes you create the relationship between two tables, and the relationship is a dashed line. In this post, I’ll explain to you everything you need to know about a dashed relationship, or as it called Inactive relationship. I will Read more about UseRelationship or Role-Playing Dimension; Dealing with Inactive Relationships in Power BI[…]

Find the Most Expensive Columns for Performance Tuning, Bookmarks, and more with Power BI Helper Version November 2018

We are excited to share you the November 2018 version of Power BI helper with many interesting features. With this version, you get the list of all pages and list of all bookmarks. You can find all bookmarks related to a page. You can also through this version find out the data columns that consume Read more about Find the Most Expensive Columns for Performance Tuning, Bookmarks, and more with Power BI Helper Version November 2018[…]

Power BI Date Dimension; Default or Custom? Is It Confusing?

If you have worked with Power BI for some time, you know that there are two types of the Date dimensions; Custom or built-in/Default. It is always confusing for people, that which date dimension is good to use, and what is the difference between these two approaches. Also based on the selection of the type Read more about Power BI Date Dimension; Default or Custom? Is It Confusing?[…]

Ignite 2018 Interviews by Reza Rad; Power BI and AI

I’ve been honored and had the opportunity to have an interview with some great minds in Ignite 2018. Just to mention a few; it was the discussion about all new Power BI and AI features announced at Microsoft Ignite 2018 conference. In this post, you will see the link to all my 14 interviews of Read more about Ignite 2018 Interviews by Reza Rad; Power BI and AI[…]