Overwrite Interaction of Power BI with DAX
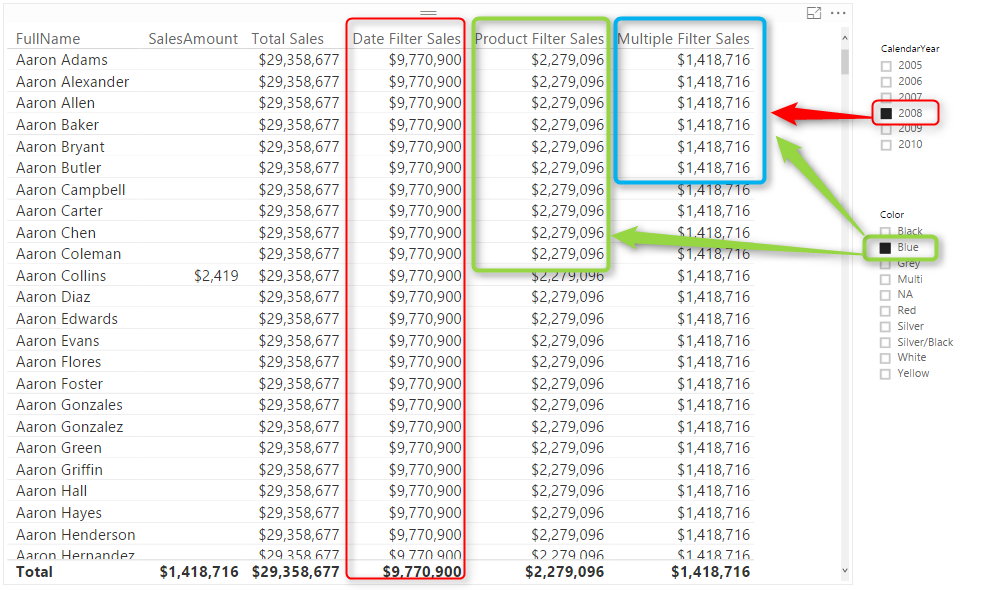
I have written a blog post while ago about using Edit Interaction to control the interaction of visuals. There are however sometimes that you want to have some of filters to be applied on (some measures) of a single visual, but others not. In this post I’ll explain one method of writing DAX expressions in Read more about Overwrite Interaction of Power BI with DAX[…]