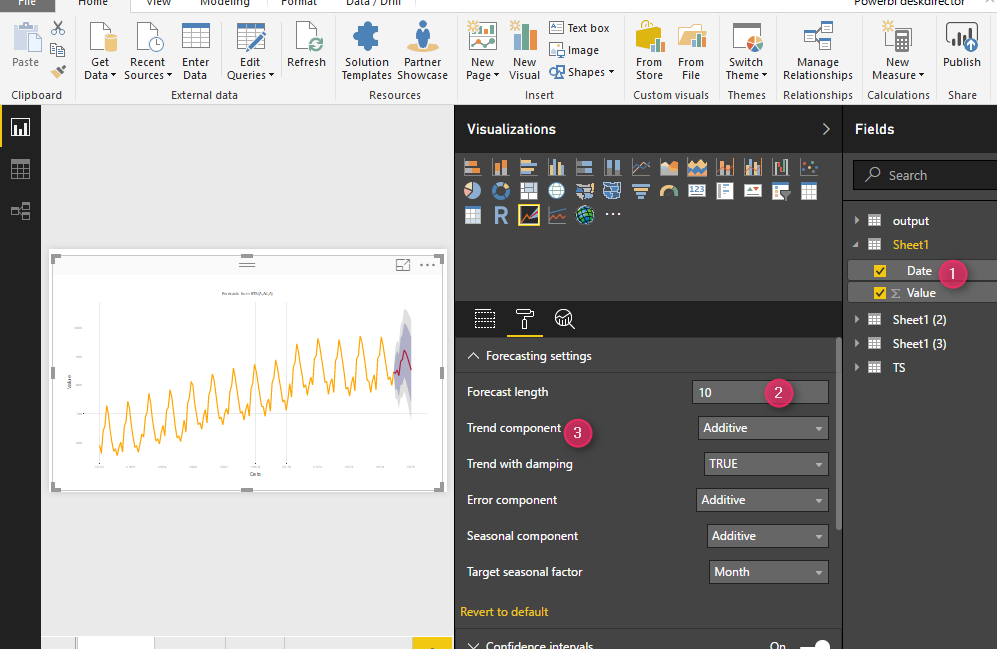
New Series of Time Series: Power BI Custom Visual (Part 5)
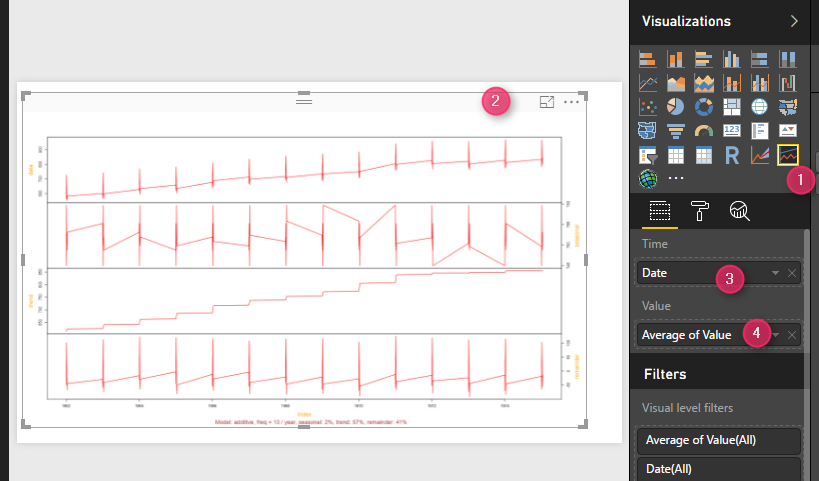
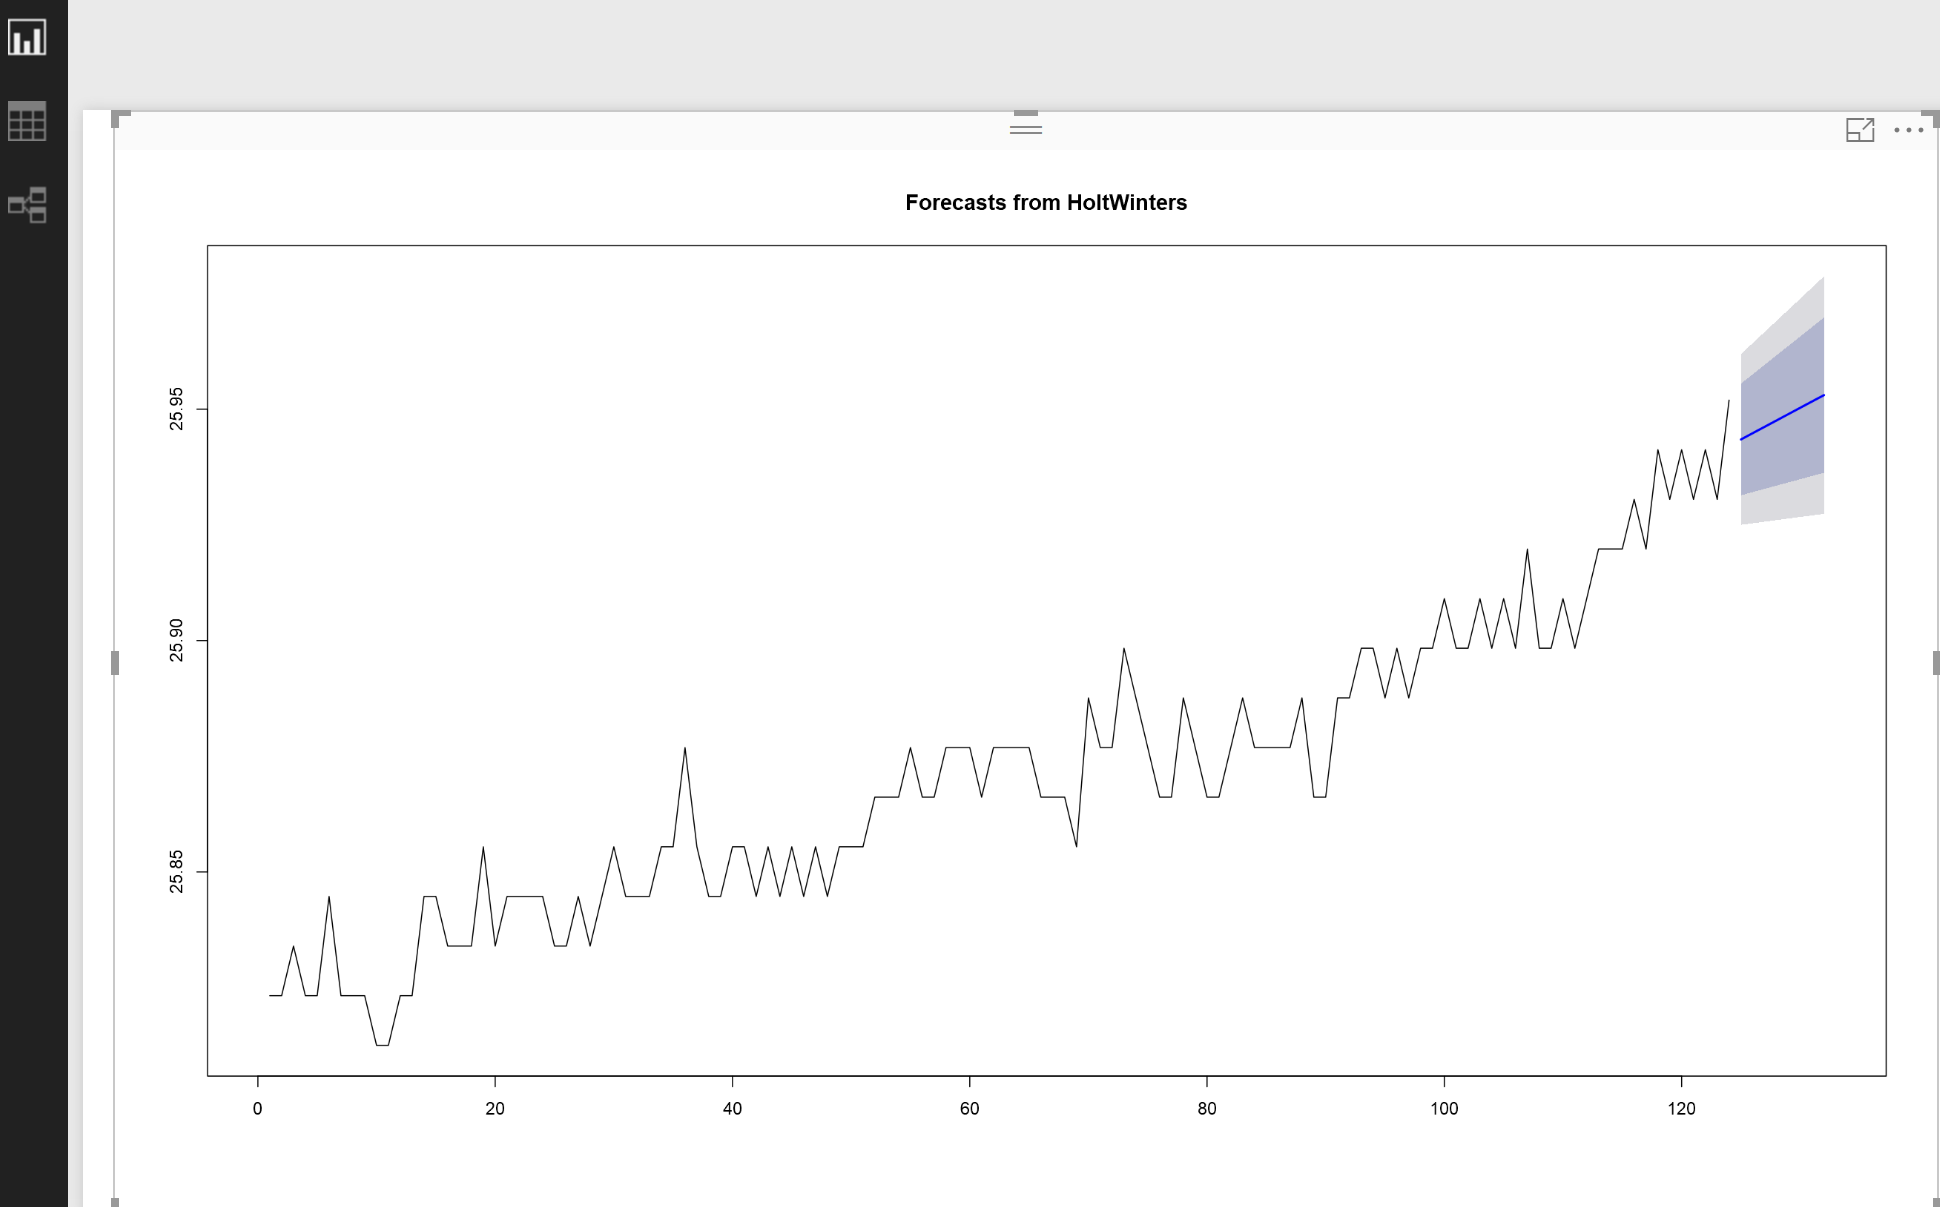
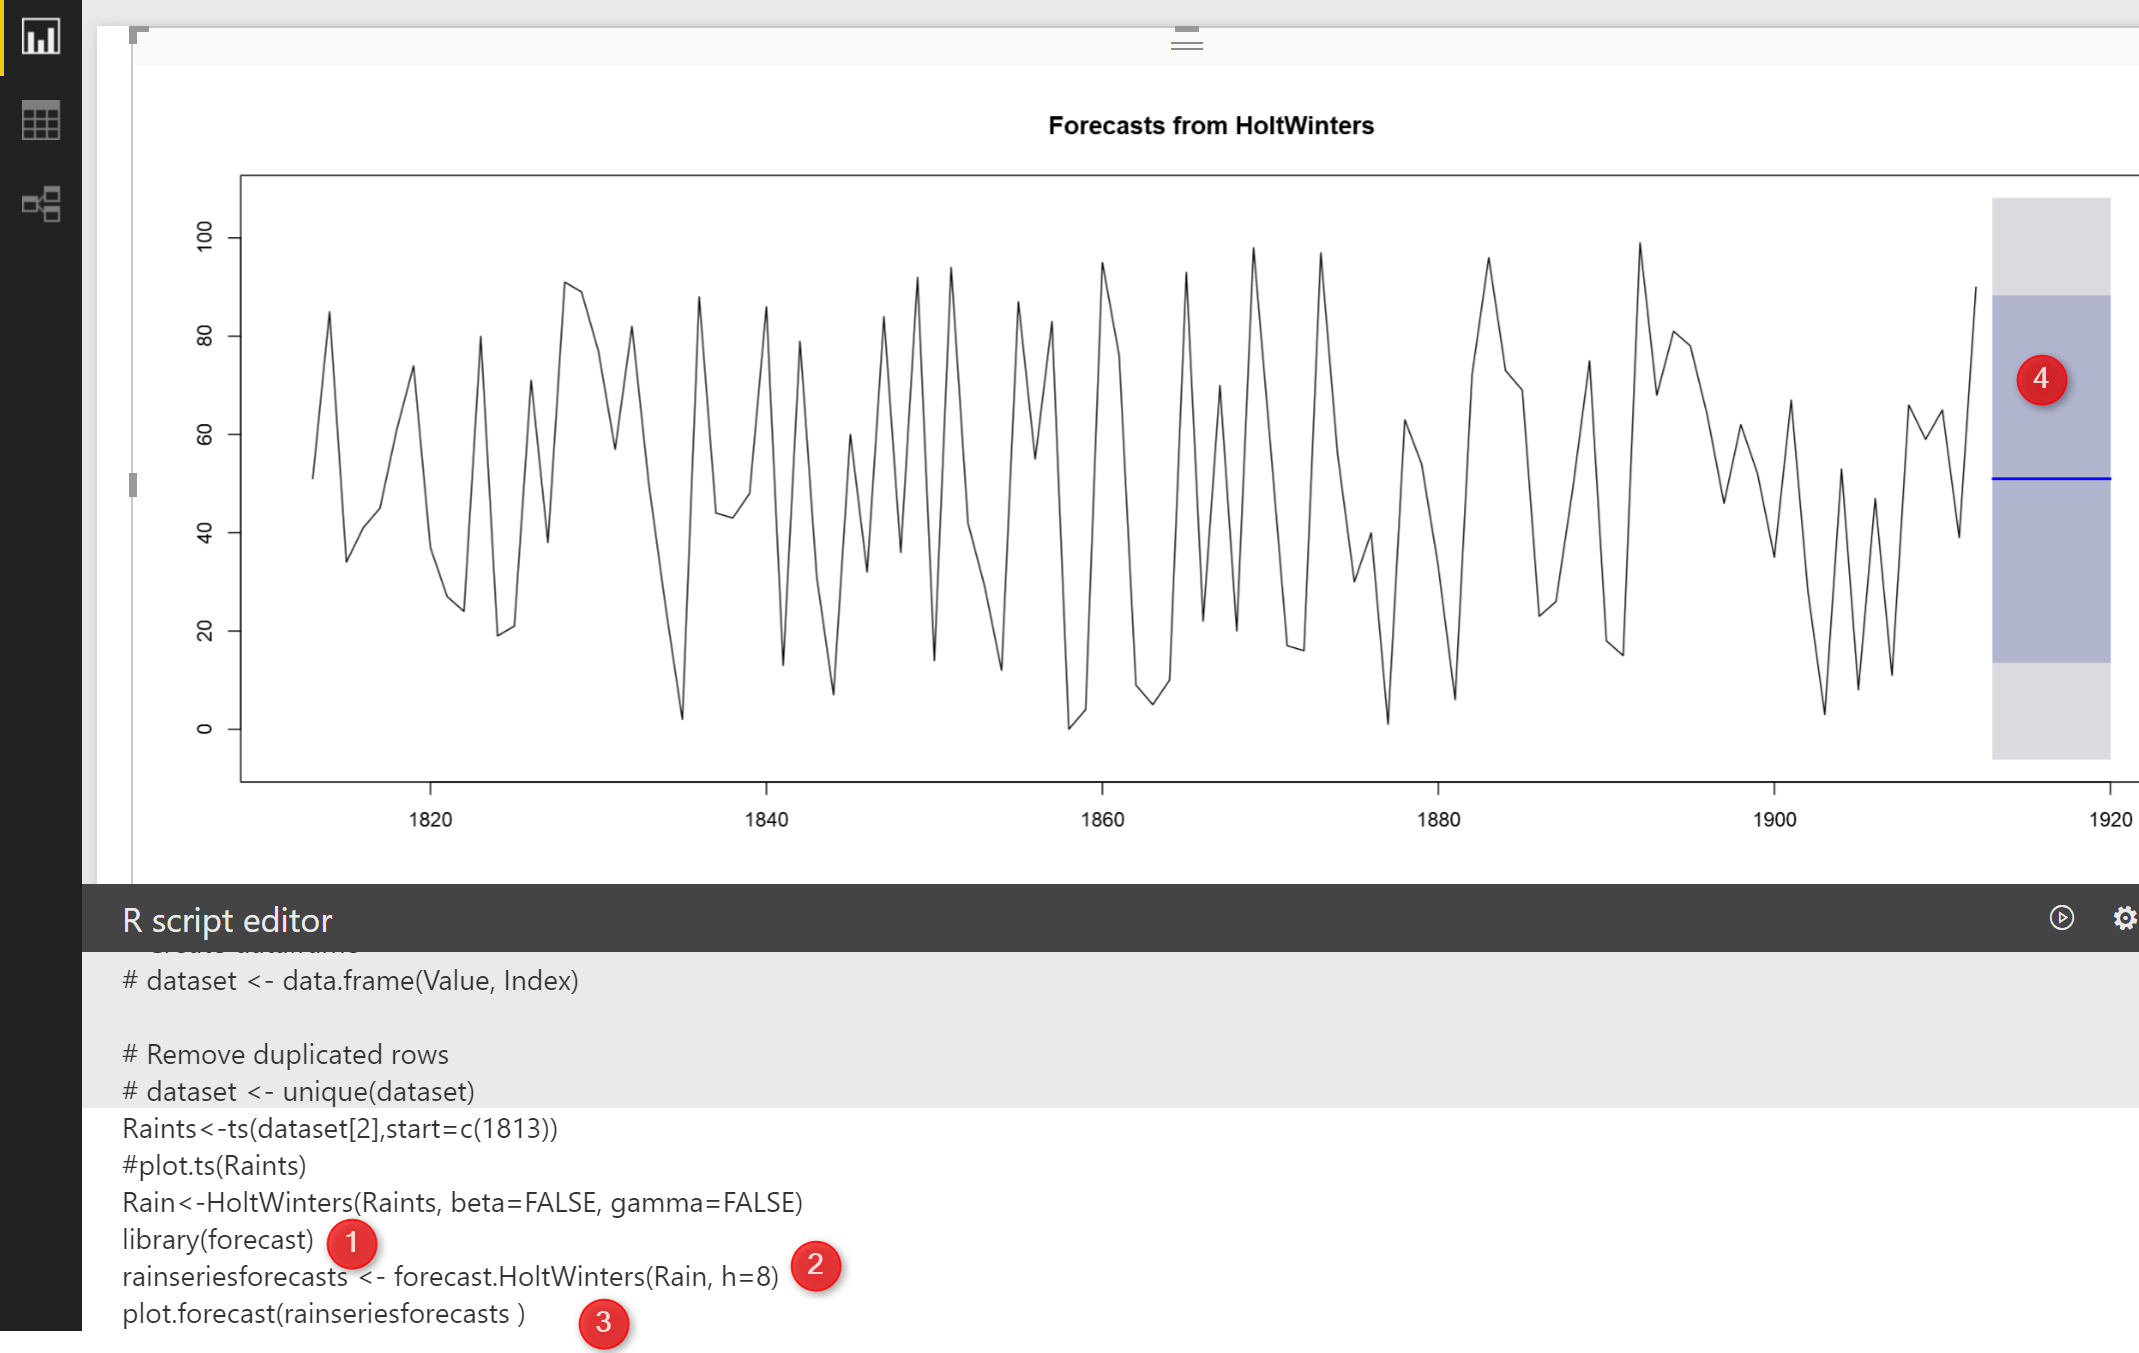
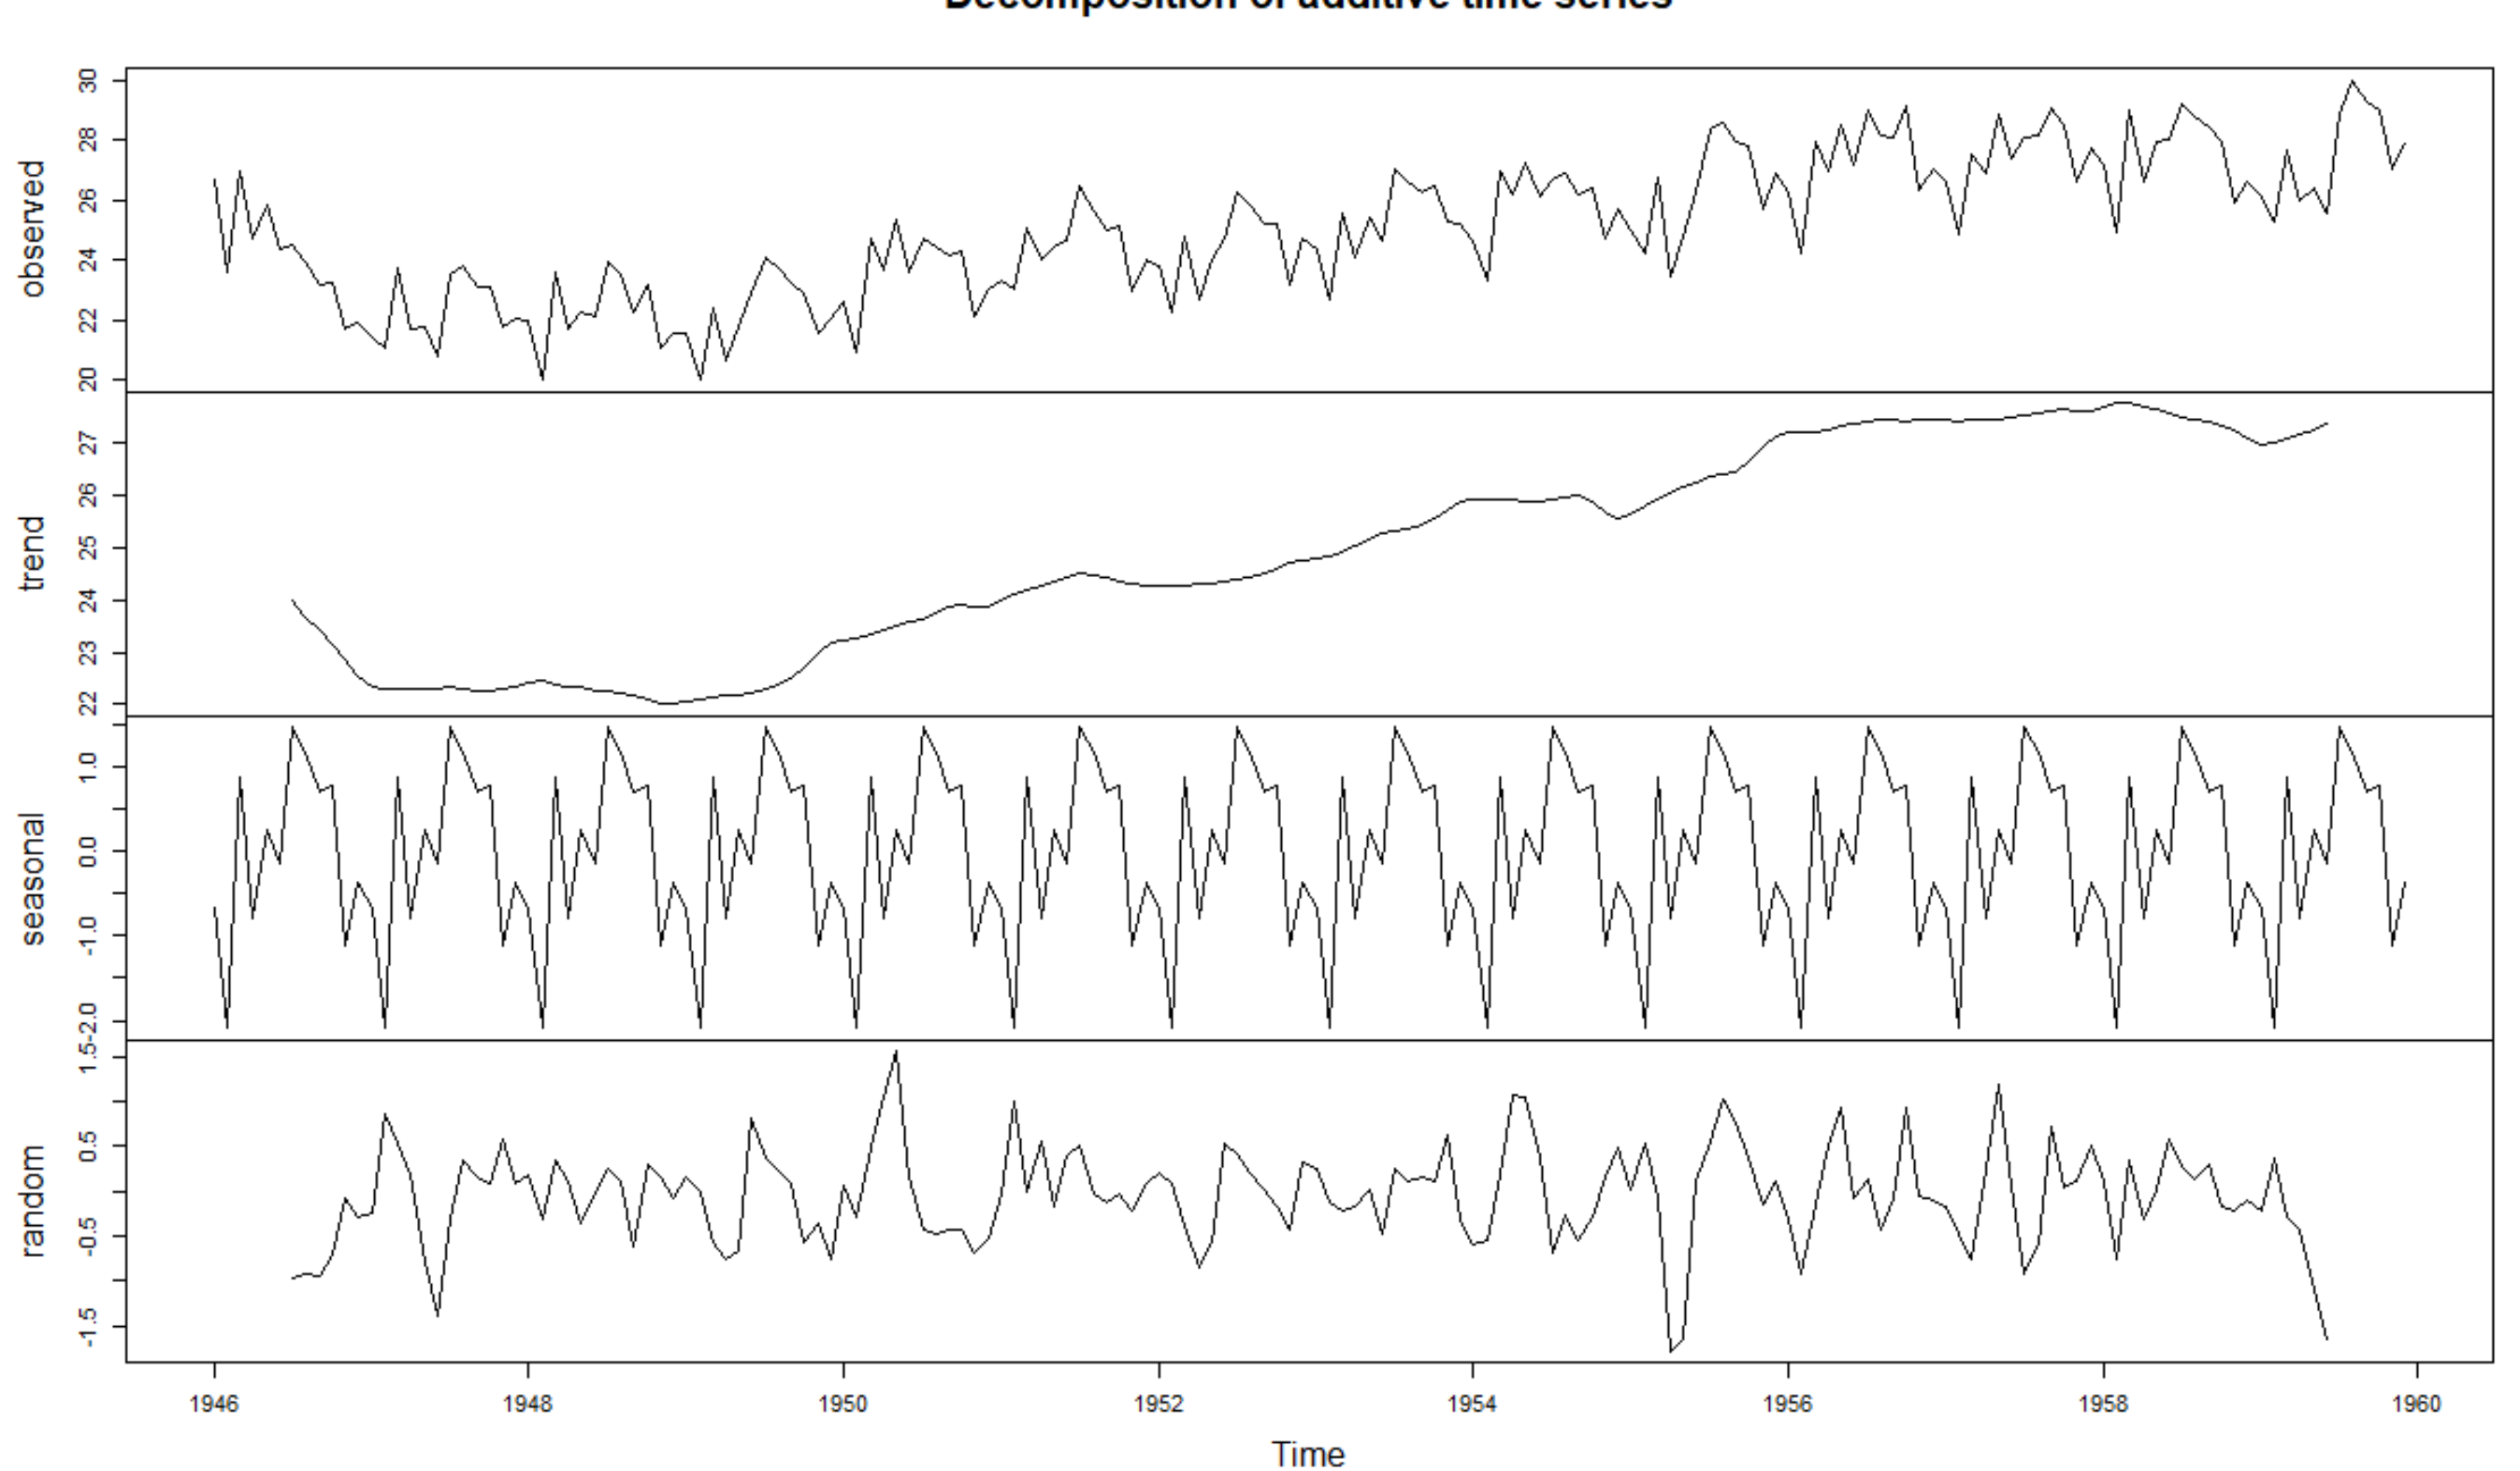
In previous posts, I have explained some basic concepts of time series. In the first post I have explained the basic concepts of time series, and in second and third posts I have explained: “Exponential Smoothing” for forecasting data without trend, and with the trend. In the last post, I have explained how we can Read more about New Series of Time Series: Power BI Custom Visual (Part 5)[…]