Azure Map in Power BI with Layers: Part Three

In the last two posts, I have explained how to access Azure Map and create bubble charts and Bar charts with other available settings. check the first Post from here and the second one from here. In this blog, I am going to talk about different layers we can have on top of the map. Read more about Azure Map in Power BI with Layers: Part Three[…]

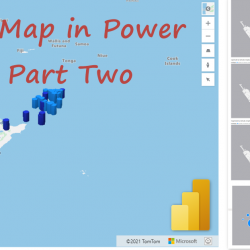
Azure Map in Power BI: Part Two

In the last post, an introduction to Azure Map was presented. Azure Map has considerations and limitations as below( that may resolve later as now is in preview) You can use it in Power BI Desktop, Power BI Service, and mobile application But, not available Power BI publish to the web, Embedded and service embedding. Read more about Azure Map in Power BI: Part Two[…]

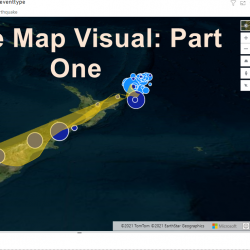
What is Azure Map in Power BI: Part One

Reza rad already wrote some articles about Map visuals in Power BI such as ArcGIS, Shape Map, and Filled Map. In this blog post, I am going to talk about Azure Map Visual in Power BI. a definition from Microsoft website: “The Azure Maps visual for Power BI provides a rich set of data visualizations Read more about What is Azure Map in Power BI: Part One[…]

Sync Slicers in Power BI

In some of the reports with many pages, some of the slicers are common, and all pages need to have them. Moreover, in some data analysis approach, we may want to apply one slicer, not on-page, but in all other pages in our reports. In this scenario, we need to use the sync slicers option Read more about Sync Slicers in Power BI[…]

Power BI Bookmarks: Grouping

Bookmarks are a way of storytelling, There are many examples of using Bookmark to show narrative storytelling check Reza Rad blog post on “Bookmarks and Buttons“. Imagine you created several bookmarks from different pages you have in the Power BI file. however, not all bookmarks are related to the same story. One related for example Read more about Power BI Bookmarks: Grouping[…]

Streamline Sharing Folder and Email Message using Power Automate ( Part 2, Send Email)

In the last post, I started to explain how I used Power Automate for my business case scenario using Power automate, Excel, and OneDrive for conference management that can be applied to all other training class scenarios.In the last post, I explained how to trigger a PowerAutomated via Excel and create a folder inside it. Read more about Streamline Sharing Folder and Email Message using Power Automate ( Part 2, Send Email)[…]

Streamline Sharing Folder and Email Message using Power Automate ( Part 1, Folder Creation)

Here I will share one of my business case scenario using Power automate, Excel and OneDrive for a conference management that can be apply to all other training class scenarios.we normally want to create a personalized folder for your students in class or for our speakers in a conference so they/we can put or files Read more about Streamline Sharing Folder and Email Message using Power Automate ( Part 1, Folder Creation)[…]

Anomaly Detection in Power BI

Anomaly detection is one of the popular topics in machine learning to detect uncommon data points in the datasets. For example, in a greenhouse, the temperature and other elements of the greenhouse may change suddenly and impact the plant’s health situation. Identifying the anomaly data in a credit card transaction, or in health data received Read more about Anomaly Detection in Power BI[…]

Ranking Chart in power BI Desktop Using Charticulator

Regarding using Charticulator for creating custom visuals, I come across one of the visuals in the Charticulator gallery and I decided to follow it up to see how it created. So I manage to create a dataset that has ranking, name and amount. https://charticulator.com/gallery/co2_emission_ranking.html In this example, I am using Carbon dioxide emission data for Read more about Ranking Chart in power BI Desktop Using Charticulator[…]

Remove Columns with Specific Patterns Name in Power BI using Power Query

I was in the middle of data transforming to create a clean dataset for a Charticulator post, that I come across a dataset as http://mdgs.un.org/unsd/mdg/SeriesDetail.aspx?srid=749 This dataset is for Carbon dioxide emissions in different countries around the world. The only columns I need from this datasets is about country name and the number of emissions for Read more about Remove Columns with Specific Patterns Name in Power BI using Power Query[…]