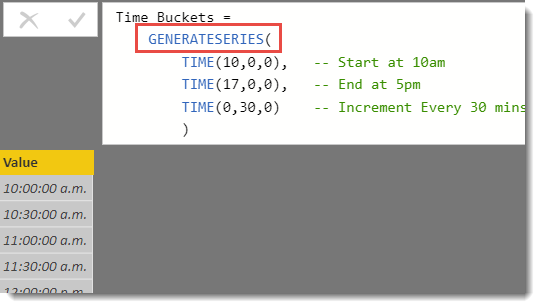
Quick DAX: Use GENERATESERIES to create Time buckets
A not so obvious use of the recently added GENERATESERIES function to use it to generate time buckets. The more common use of this function is to generate series of numbers, but it works just as well with Time based data. Say you want to create a data table with rows that represent time periods. Read more about Quick DAX: Use GENERATESERIES to create Time buckets[…]