Power BI – Banding and stripes in charts

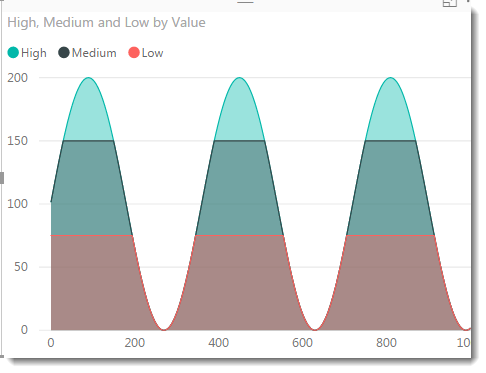
This blog will show a technique that can be applied to certain charts allow banding or stripes to help highlight data. This could be horizontal bands to help show data above or below a certain threshold, or this could be vertical bands to help highlight ranges of data by time.  In both cases, using What-If Read more about Power BI – Banding and stripes in charts[…]

How to generate 1 billion rows using U-SQL

I was interested in generating some dummy data to do some load testing in MS Azure and came up with a pretty nifty way to generate lots and lots of data using U-SQL.  The tip is to simply create a small U-SQL custom generator and use it to extract from a dummy file. First I Read more about How to generate 1 billion rows using U-SQL[…]

Taking a byte out of U-SQL

I recently had a requirement to combine a set of approx. 100 CSV files into a single file and encountered an interesting problem along the way. The files all had the same simple structure which was 2 columns.  I thought this would make a pretty straight forward exercise – until I started processing the files. I Read more about Taking a byte out of U-SQL[…]

Dynamic SQL Using Power Query

Every so often I find myself needing to import data, but only want data relevant to values already existing in my data model.  This is common where I build smaller models based on a subset of fact or transaction records.  Rather than bring in entire dimension tables, I may only need the dimension records that Read more about Dynamic SQL Using Power Query[…]

5 interesting points from MDIS 2017

After a whirlwind 4 days in Seattle I finally have some time to think back over the Microsoft Data Insights Summit and digest what were probably some of the more interesting points to come out of the Summit.  Most of these came from the keynote so if you would like more detail on any of Read more about 5 interesting points from MDIS 2017[…]