
In the last two posts, I have explained how to access Azure Map and create bubble charts and Bar charts with other available settings.
check the first Post from here and the second one from here.
In this blog, I am going to talk about different layers we can have on top of the map.
In this part, we are going to check the
Reference layer and Traffic Layer
Refrence Layer
According to the Microsoft website Reference layer in Power BI is
The reference layer feature lets a secondary spatial dataset be uploaded to the visual and overlaid on the map to provide additional context.
The file should be in a GeoJSON format. that thas the .json or .geojson extension.
GeoJSON File
For this blog, I am going to use a shape map about the New Zealand region from Here. This file has been using in a blog about Shape maps written by Reza.
I could not use this one as it is a shapefile, I need to convert it into GeoJSON format.
Here my the shapefile I used and download from Koordinates.com
The result is a zip file, you can download from below
New Zealand shape Data (23790 downloads )There is a website name “mygeodata.cloud/conversion” that converts shapefile format to GeoJSON or any layers to different types of layers ( like KML, GML, JSON, Topojson and so forth)
you need to upload the whole Zip file from Koordinate.com. as below
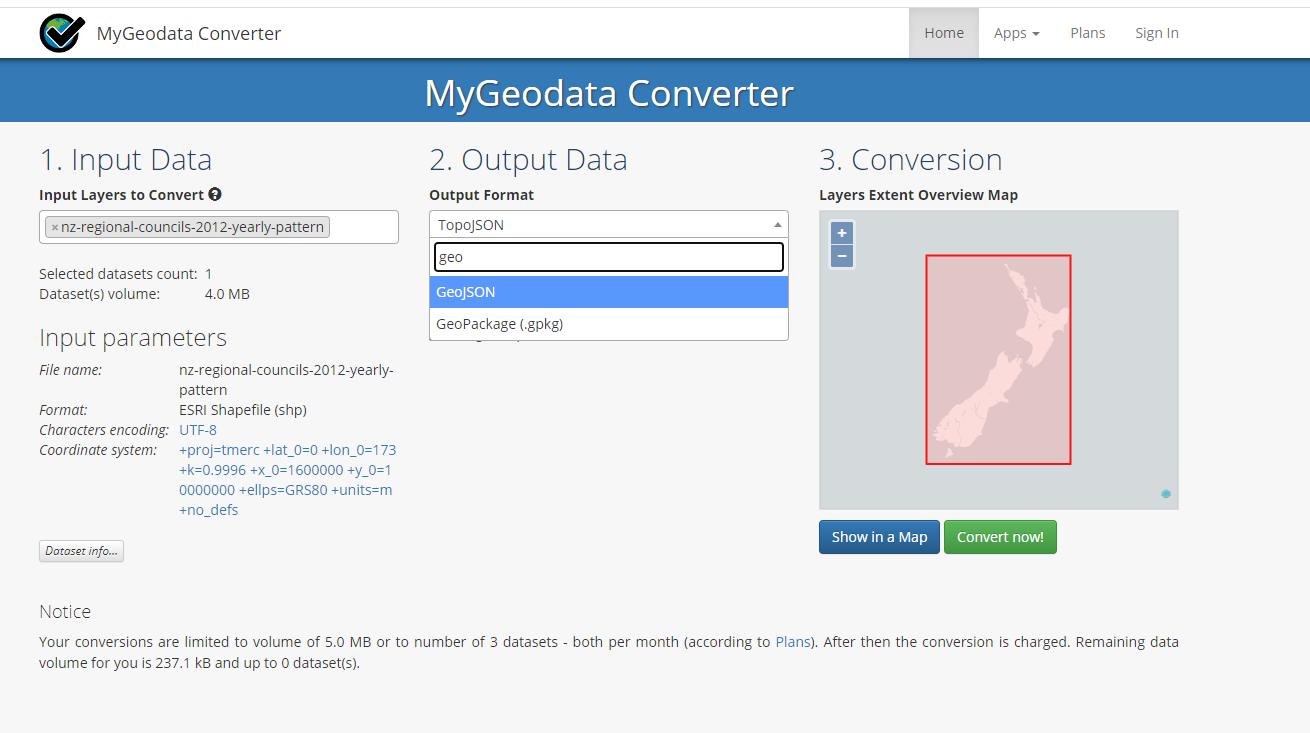
In the end, it gives you a GeoJSON, just remember to check the Merge output files. (Your conversions are limited to the volume of 5.0 MB or to the number of 3 datasets for this website)
After converting to GeoJSON, you can upload it into Power BI Azure Map visual.
download GeoJSON file from here
GeoJSON file (24353 downloads )Now you can use it in the Power BI desktop Azure Map visual.
Azure Map Visual with GeoJSON Layer
In this part, you need to click on the Format, then Reference Layer, click on Add Local file.
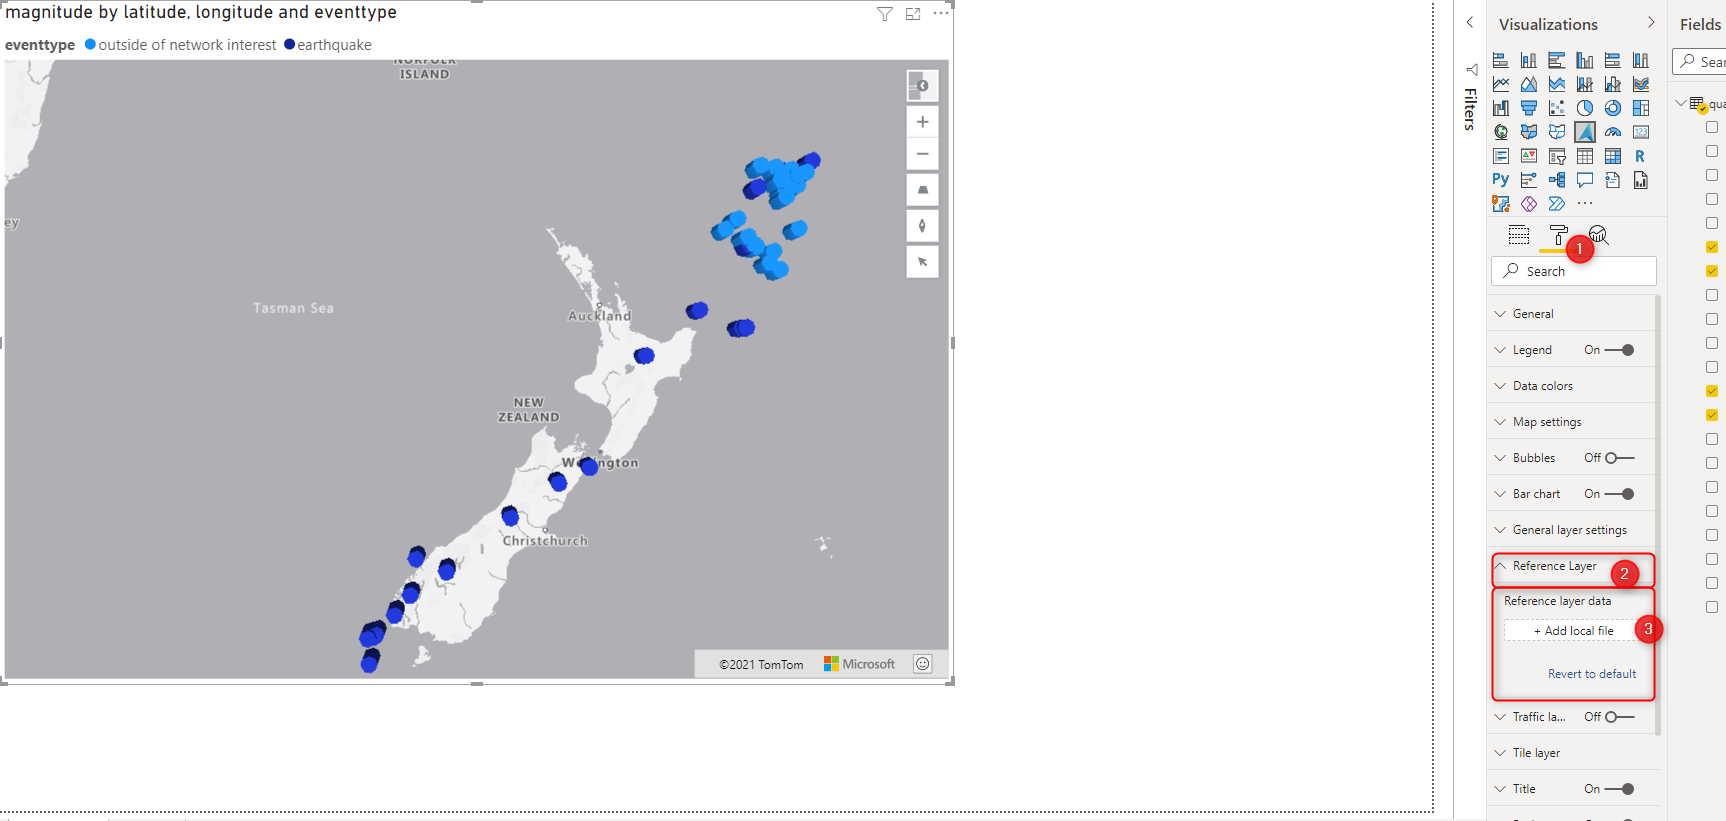
The Map should Look like as below
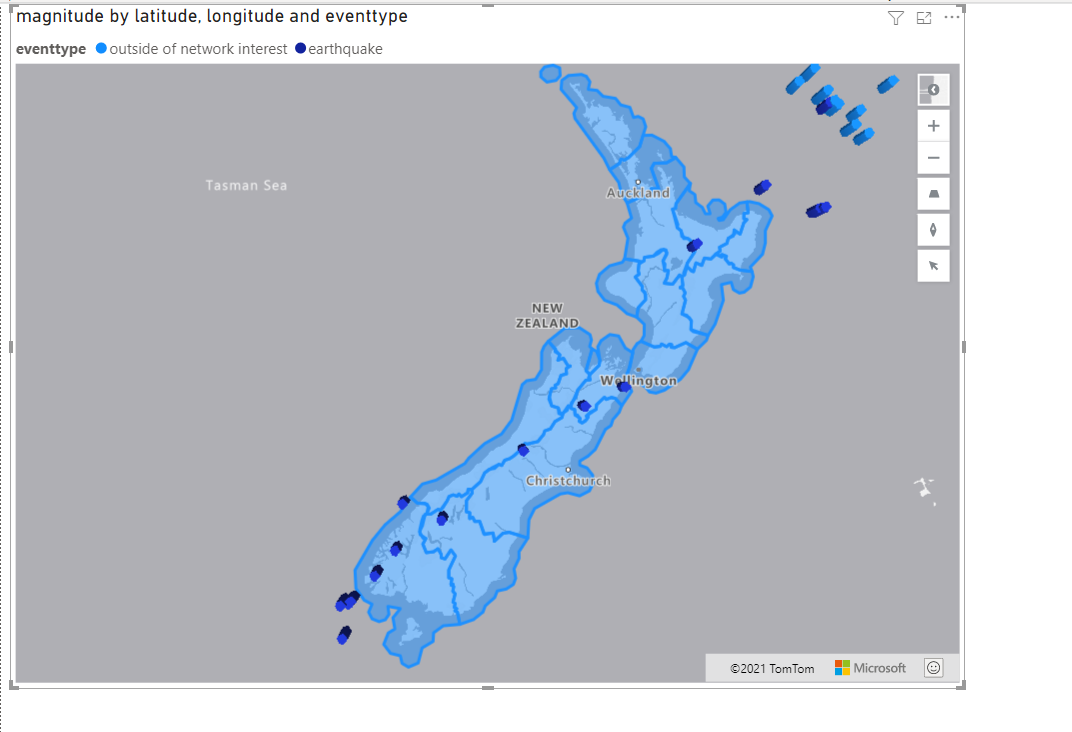
As you can see in the above visual, the Auckland region layer map has been put on the top of the original map.
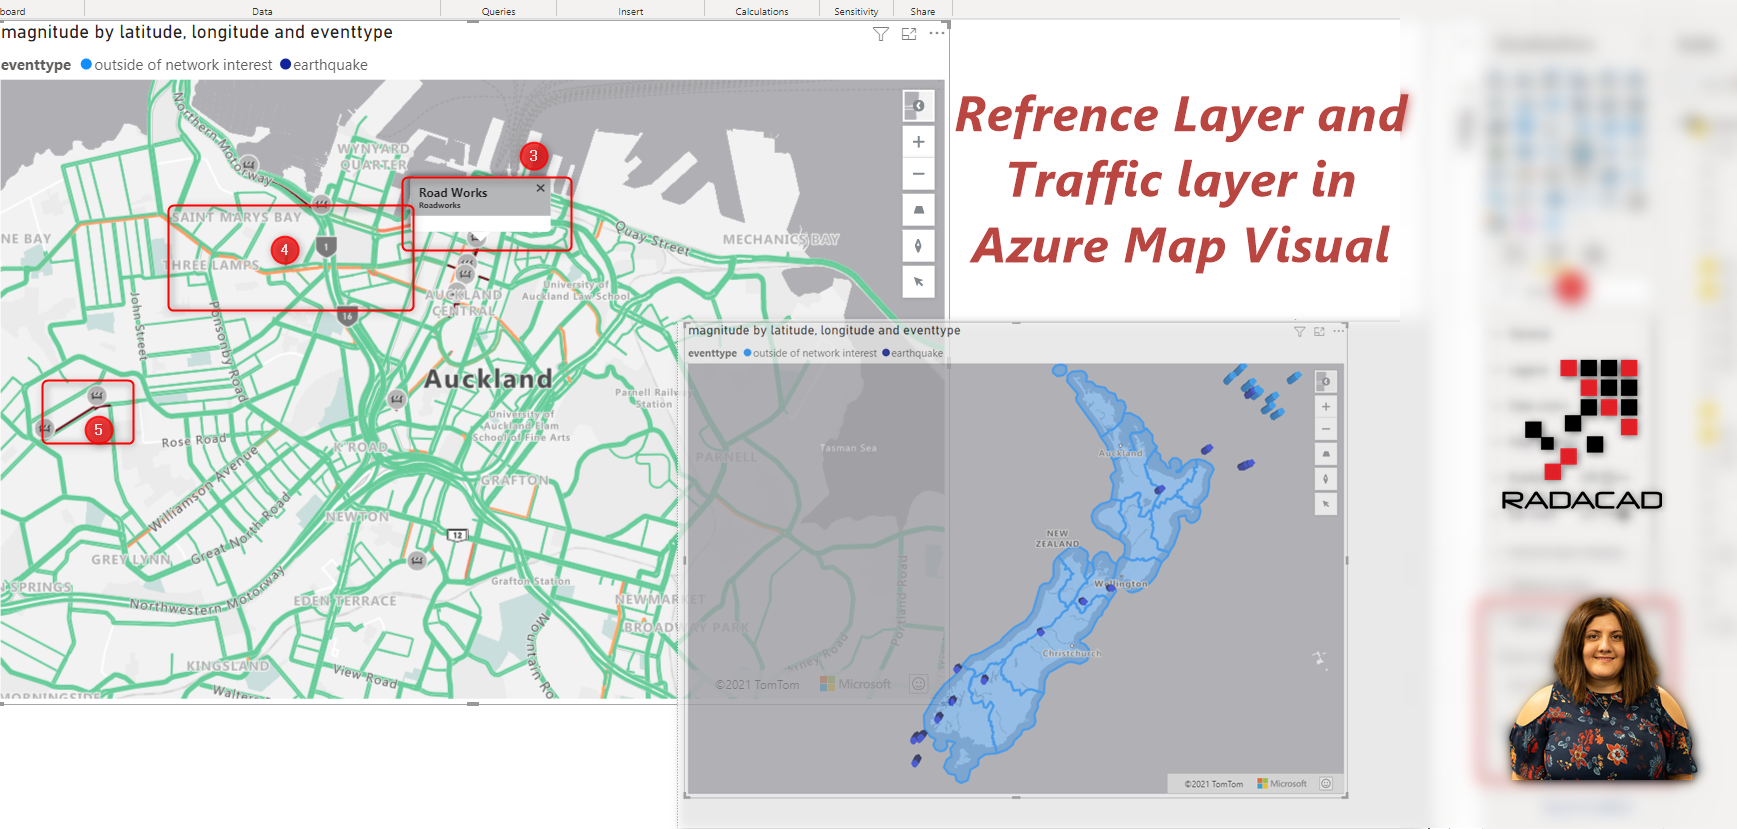
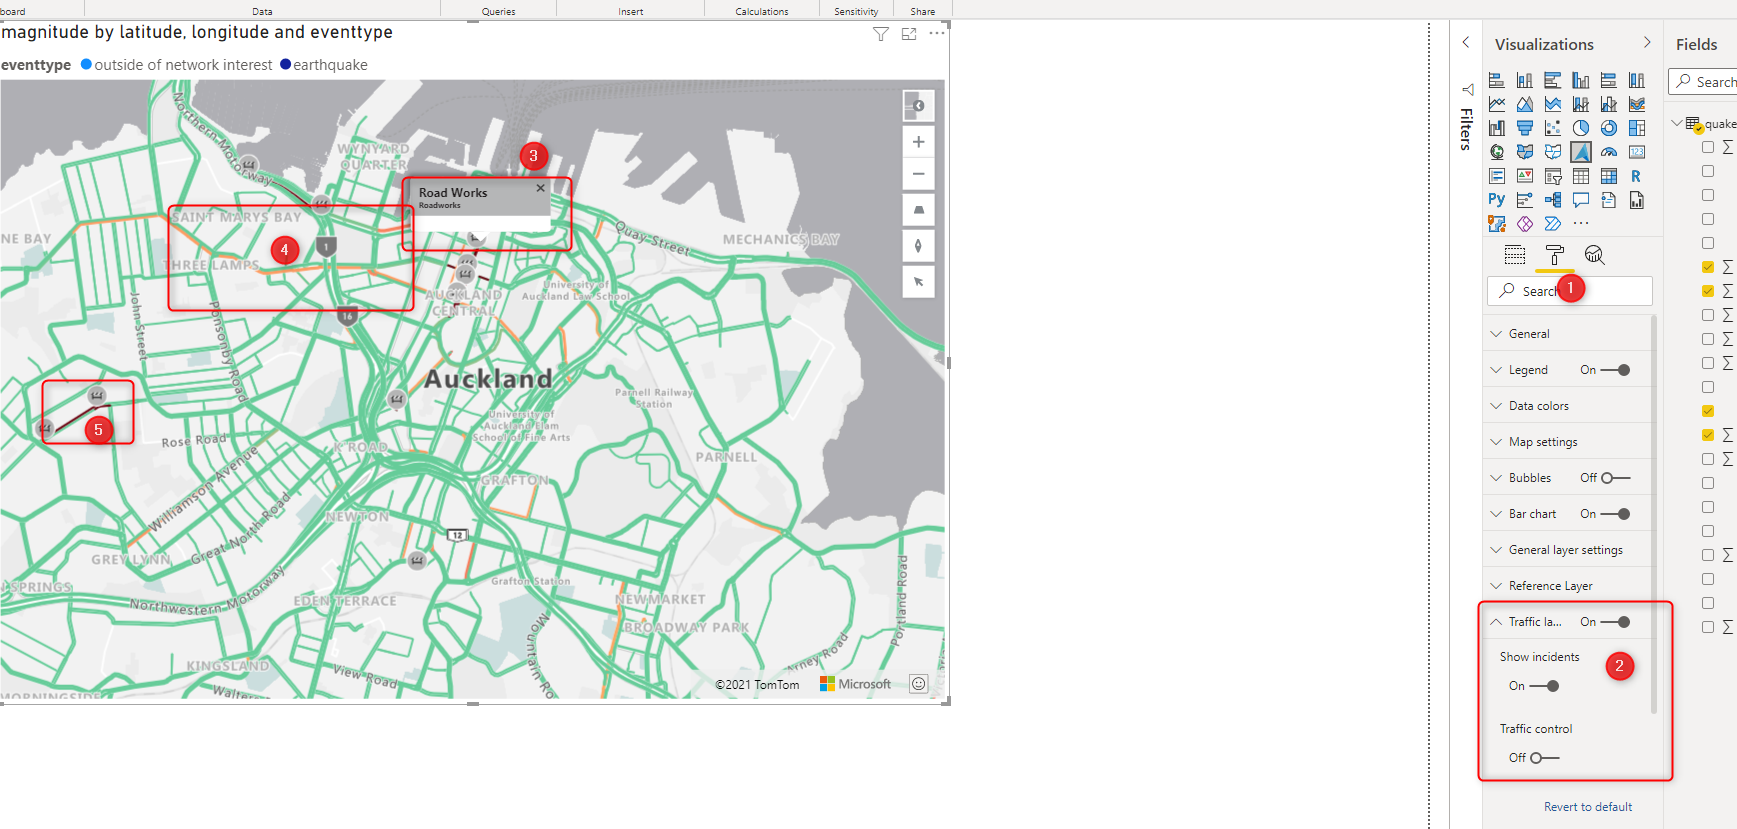
Traffic Layer
there is a pre-build Layer name Traffic Layer, that shows the real-time traffic data on top of the map, to enable this one, you can click on the format of the visual, then click on the Traffic Layer section and Enable it.
As you can see in the below screenshot, the map showing all Road works traffics ( We are in Lockdown so no that matches traffic there 🙂 )
In the next post, I am going to write about how to create and use a Tile Layer in Azure Map visual.


