

When I explain the Star Schema and best practices of data modeling in Power BI, Often I get questions such as what if we want to have budget and actuals in the same data model? what if there are two tables with different granularity? We cannot solve it with simple data modeling and relationships, this needs complex DAX calculation! My answer is: That can be also solved with a zero complexity model. In this article, I’m going to explain through an example, how two tables with different granularity (like budget and actual) can be modeled easily using Power BI. To learn more about Power BI, read the Power BI book from Rookie to Rock Star.
Prerequisite
There is no prerequisite for this article. However, I highly recommend you to read below articles beforehand;
- What is the Relationship in Power BI?
- What is the Cardinality of the Relationship?
- What is the Direction of the Relationship?
- Data preparation; First and Foremost Important task
- What is a Dimension table and why say No to a single big table
- Basics of Modeling in Power BI: Fact Tables
- Combining Dimension Tables in Power BI using Power Query; Foundation of Modeling in Power BI
- Star Schema and How to Build It
- Creating a Shared Dimension Using Power Query and Power BI
- Build Your First Star Schema Model in Action
Sample Dataset
The sample dataset used here is the AdventureWorksDW Excel file which can be downloaded from here.
Sales Star Schema
A fact table is a table that contains happening of action, it keeps numeric and aggregatable data in it (If you want to learn more about Fact tables, read this article). An example of a fact table is the FactResllerSales table in the model below, which is connected to DimProduct, DimDate, DimSalesTerritory, and DimEmployee.
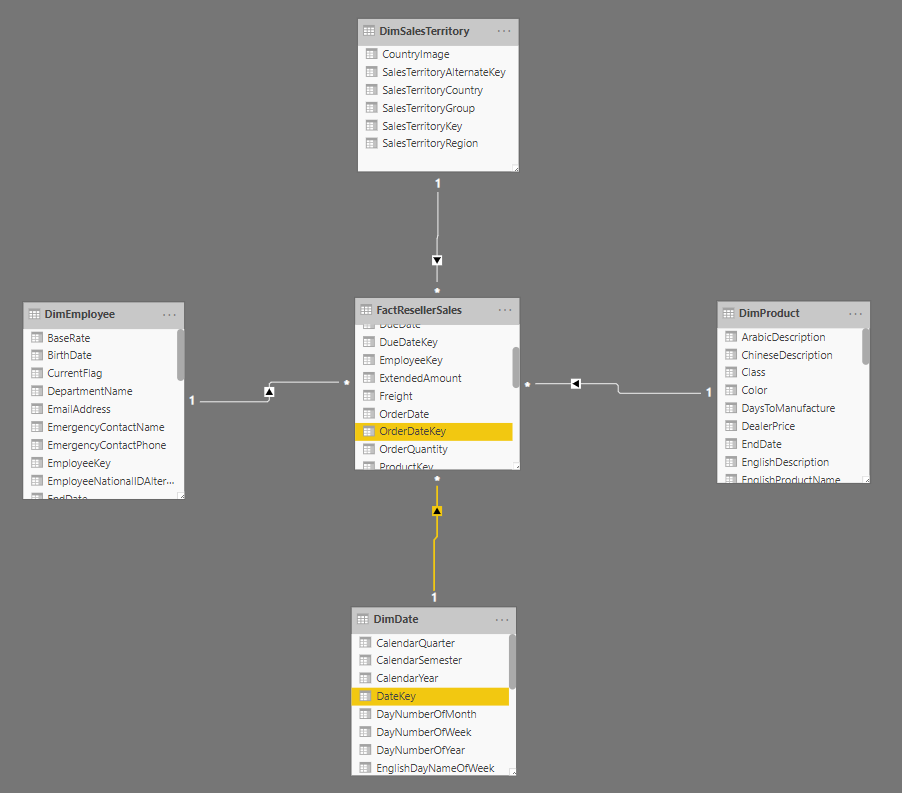
To create this model;
- Get data from AdventureWorksDW data source from above
- Select all the tables mentioned,
- Remove the relationship between DimSalesTerritory and DimEmployee
- Set the relationship between FactResellerSales and DimEmployee as Active
- Create a relationship between OrderDateKey in the FactResellerSales table and the DateKey in the DimDate table
The model above is a perfect representative of a star schema model (Here I explained what star schema is, and how to create it in action). This model can easily answer all questions regarding sales. However, it seems difficult to think about star schema, when you want to bring another model with different granularity.
Sales Quota: Different Granularity
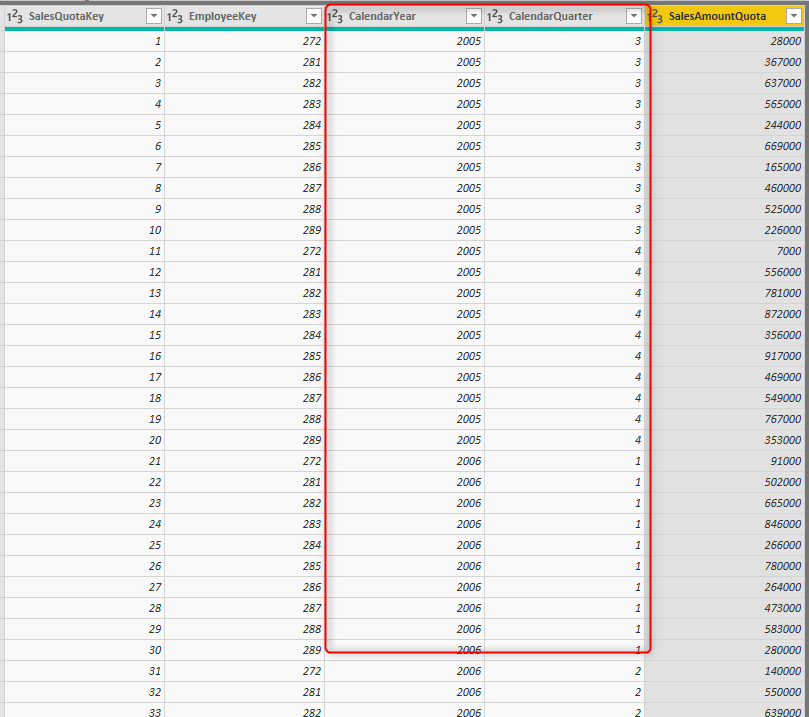
For this example, instead of the budget data, I have Sales Quota which is under a different granularity. The concept and principles remain the same. we have a table with a different granularity which we want to connect to this model. The Sales Quota has the quota of sales for each employee in each quarter. The granularity of this table is per employee and per quarter, while the granularity of the sales table is per employee, per day, and per combination of SalesTerritory and Product also.
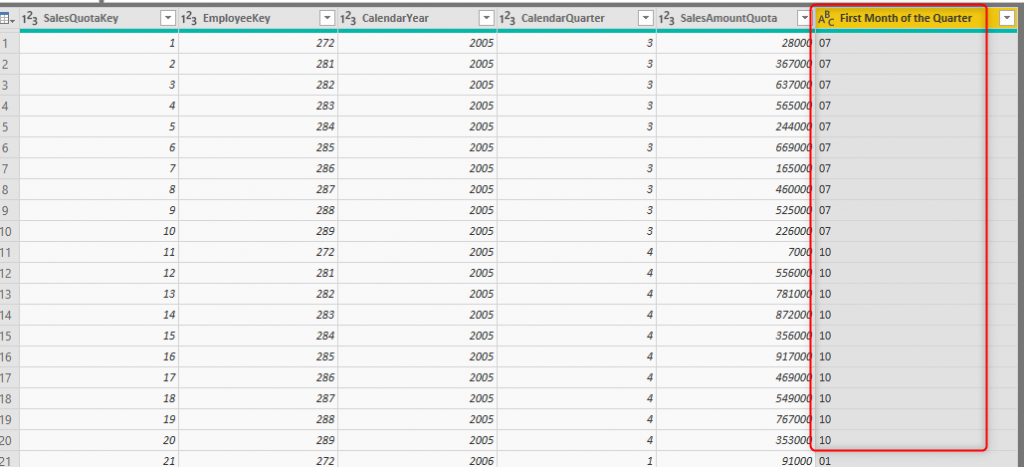
If you get the FactSalesQuota from the AdventureWorksDW, you will notice that there is a Date column, and the DateKey, which I have removed in my example below, because they will be confusing for you to understand the table is showing quarterly data (we will calculate the date key later on in this article)
Here is how the data in the Sales Quota table looks like: (FactSalesQuota in the AdventureWorksDW)
Challenges of Two Different Granularities
If you want to build the star schema for Sales Quota and Sales (similar to Actual vs Budget), then the challenge would be;
- How to connect The Sales Quote to the date table?
- If I create a Quarter dimension, then how to connect Quarter dimension to the date dimension? does this create a snowflake scenario?
I’m going to explain an easy method to solve it and then it will be a proper star schema again. Let’s check it out.
Connect SalesQuota to the Date Table
Although the sales quota information is quarterly based, you can still connect it to the date table. This would avoid creating an extra dimension for the quarter and snowflake between quarter dimension and the date dimension. The only thing to consider is that you have to consider a specific date in each quarter as your default value. For example, we can consider the first day of each quarter as our date value.
To achieve, this purpose, we need to create a column in the SalesQuota table with has the DateKey in it (the DateKey used in my sample is in this format YYYYMMDD), so It can be something like 20190101, 20190401, and etc). This is what we are going to build in this part:
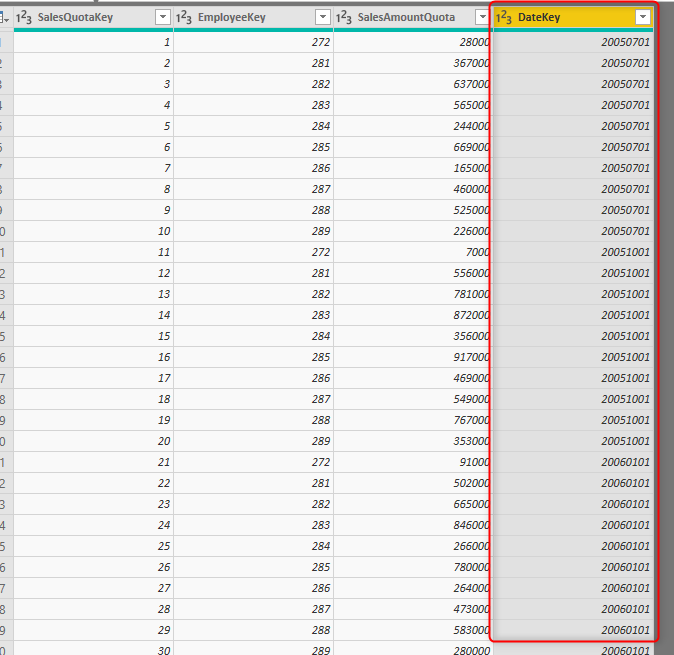
To create that field, you can easily do these steps:
- Create month number based on the quarter number
- Create the first date of that month as a custom column
Your budget data might be already in the month level, in that case, you can skip this part 1, and jump into part 2.
To create the first month of the quarter from the quarter number, you can follow a simple calculation of ((<quarter-1>*3)+1), as below:
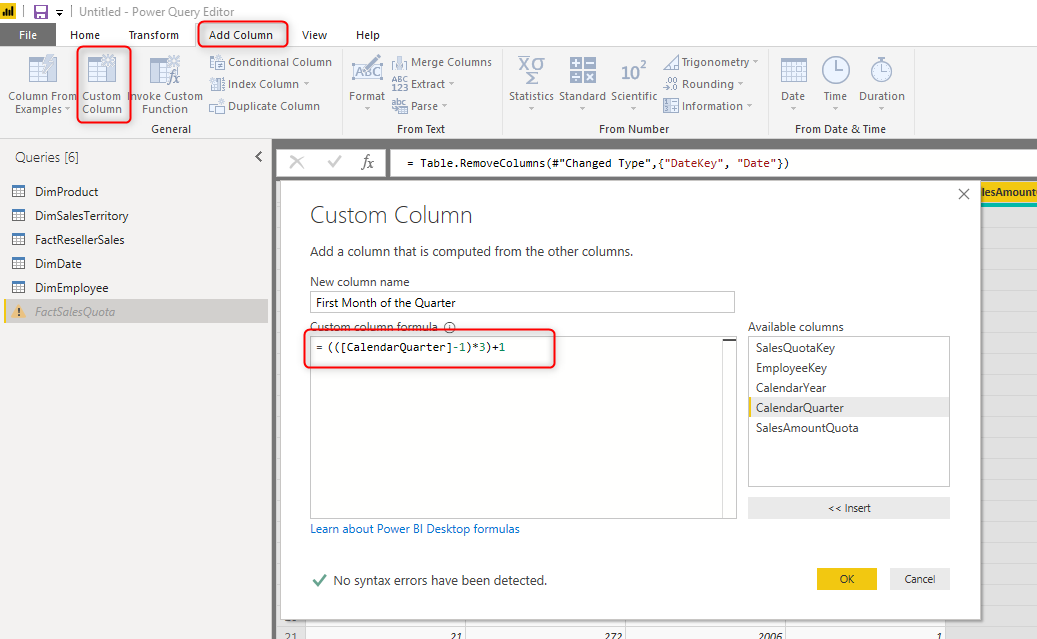
The calculation above is done in the Power Query Editor.
The second part is to create a DateKey based on it;
To do this part, first you need to make sure the month number is a two-character length field, you can do that with three steps: 1. converting the data type to text. 2. adding a prefix of “0” to this column. 3. Extracting the right two characters of this column.
Note that if your date key is a full date field, then you need to take a different approach.
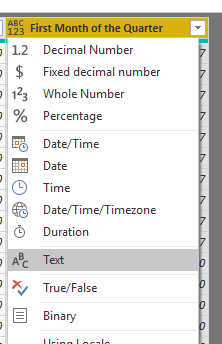
Convert the data type to text:
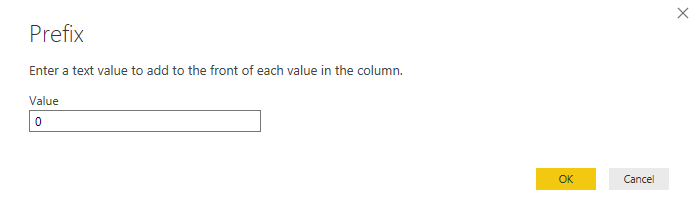
Then add a prefix to the column:
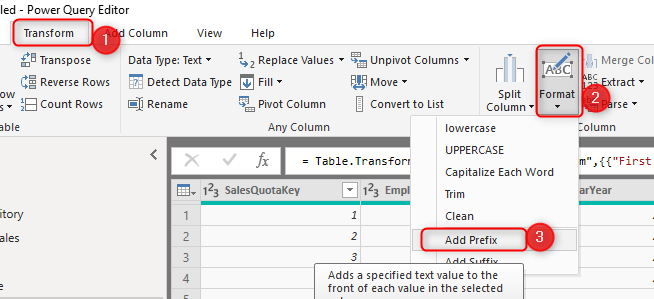
and add zero as the prefix.
Then extract the last two characters
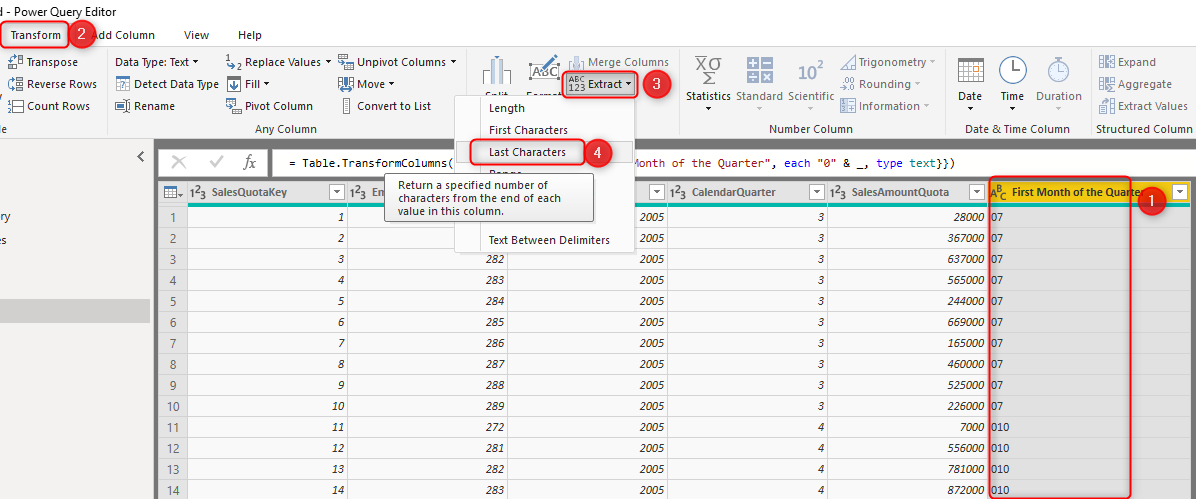
The final result would be:
Now that we’ve got everything needed, the last step is to create a custom column which is the concatenation of Year, Month, and the day; (Make sure that before this step, you changed the data type of CalendarYear to Text)

And then change the data type of the DateKey to the Whole Number, you can also remove these columns: CalendarYear, CalendarQuarter, and First Month of the Quarter
I haven’t explained the details of each step, because your data might not be at quarter level, and the date key that you use might have a different format. You might even use Merge option in Power Query, to connect this to an aggregated version of the date table, based on year and quarter, and then fetch the first of each quarter from the expand column. No matter how you do it, The main point of all these steps is to make sure you can connect your table to the date dimension without needing an extra dimension.
Star Schema Everywhere
After adding the DateKey to the Sales Quota table, you can connect it to the date table, and also employee table, as you can see, we still have Star Schema everywhere. Note that you can have multiple fact tables, and multiple star schema’s in one model.
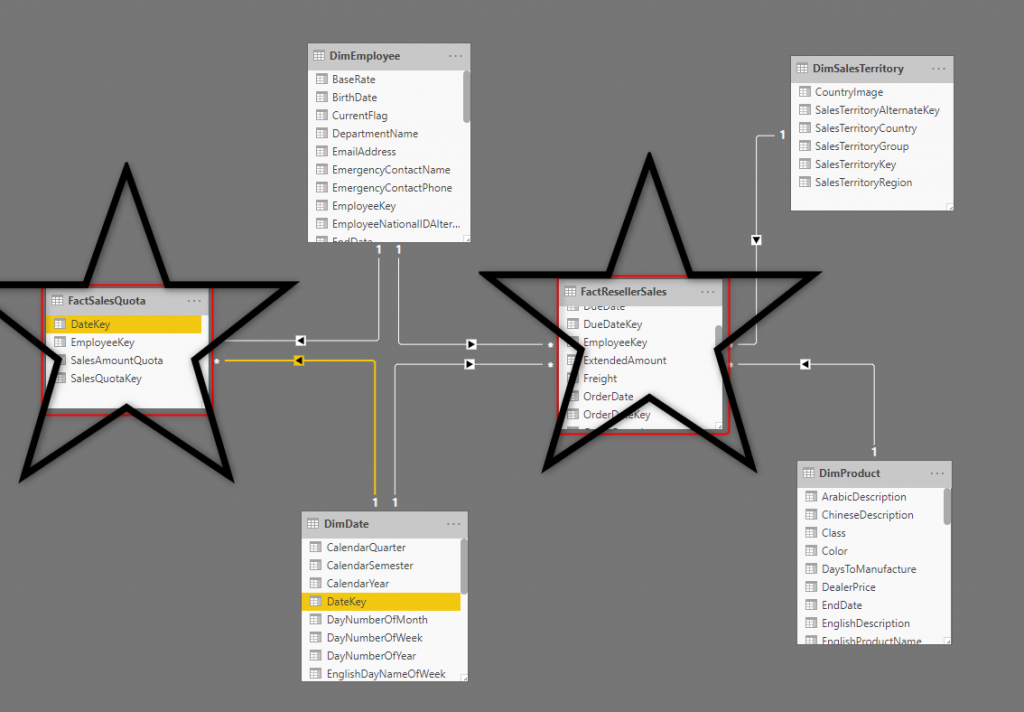
There is no need for a bi-directional relationship, or connecting a dimension to another dimension. This model can answer your budget vs actual questions easily!
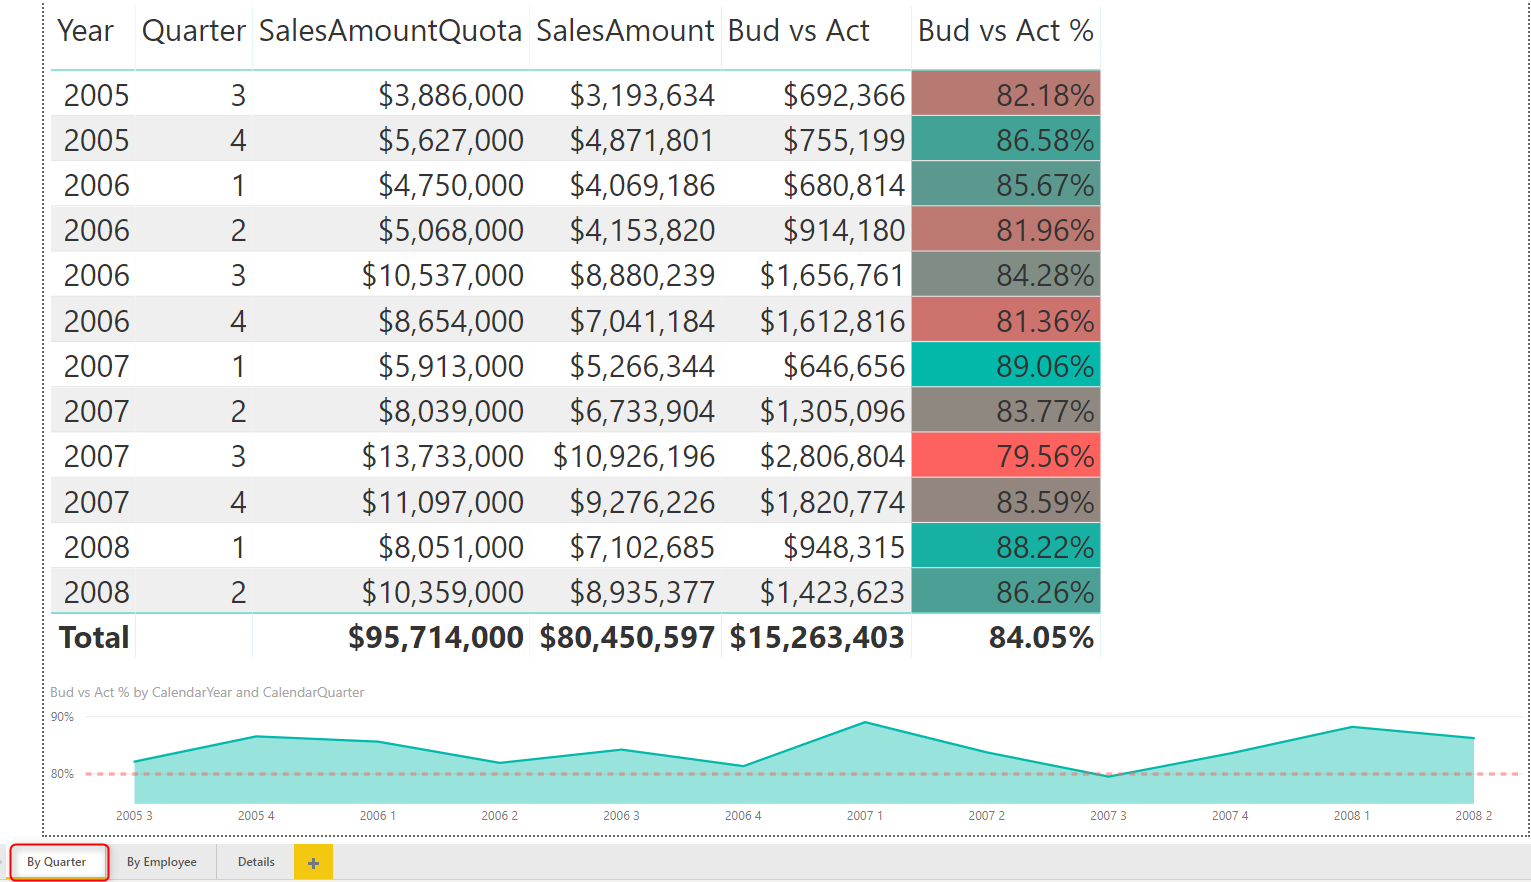
Sample Analysis
To show you some sample analysis I fetched from the Sales Quota vs the Reseller Sales in the above scenario, I have created some visual reports. All these visuals work without needing any complicated DAX calculation or bi-directional relationship. All of that is possible because the data model is set up right!
Simple DAX Measures
I only created two measures for this calculation! very simple measures: Bud vs Act:
Bud vs Act =
var Act=SUM(FactResellerSales[SalesAmount])
var Bud=SUM(FactSalesQuota[SalesAmountQuota])
return
Bud-Act
and Bud vs Act %:
Bud vs Act % =
var Bud=SUM(FactSalesQuota[SalesAmountQuota])
var Act=SUM(FactResellerSales[SalesAmount])
return
DIVIDE(act,Bud)
Sample Reports
And here are my reports:
By Employee:
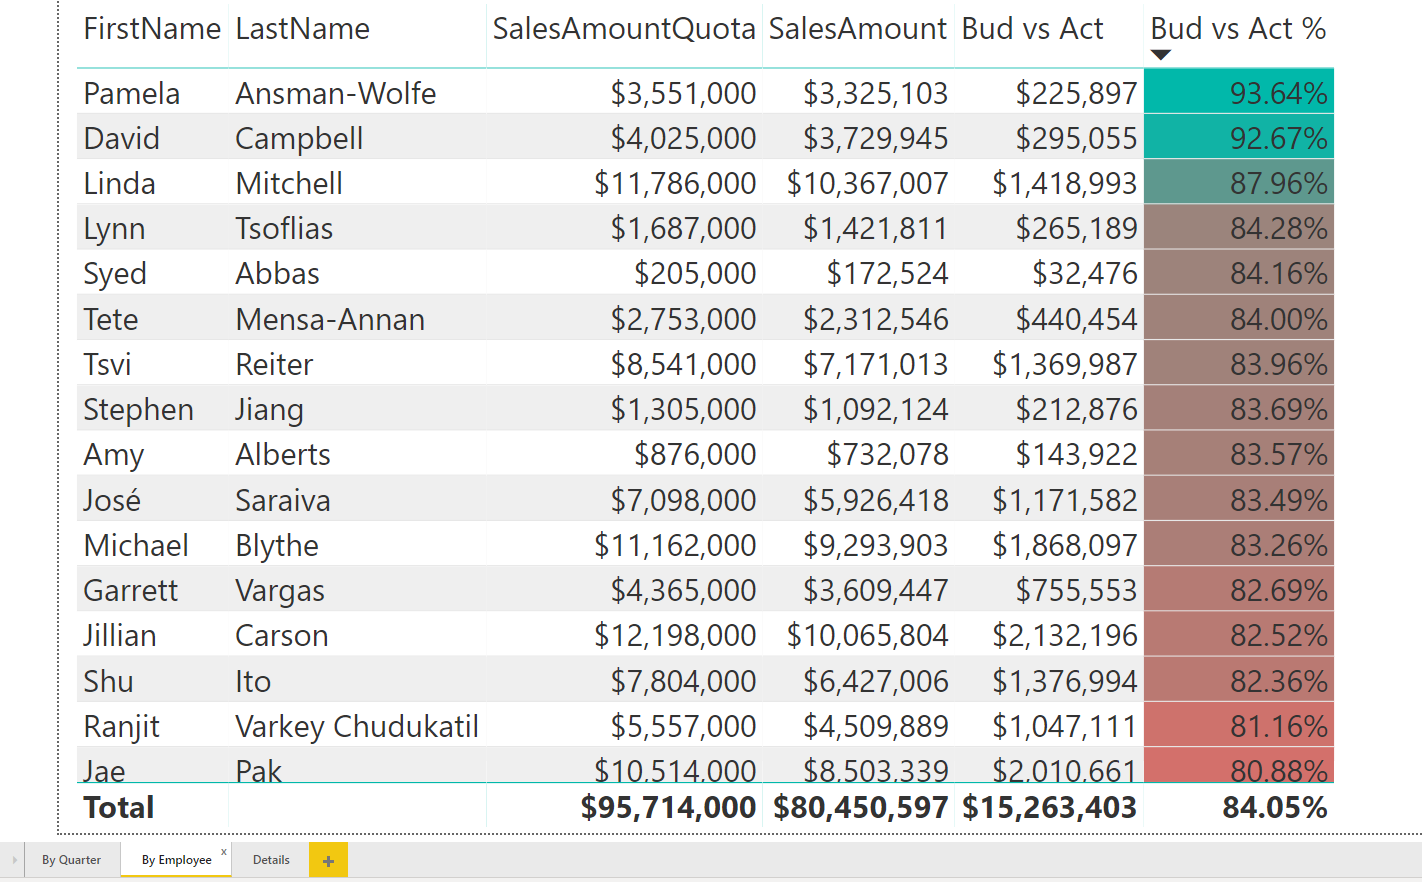
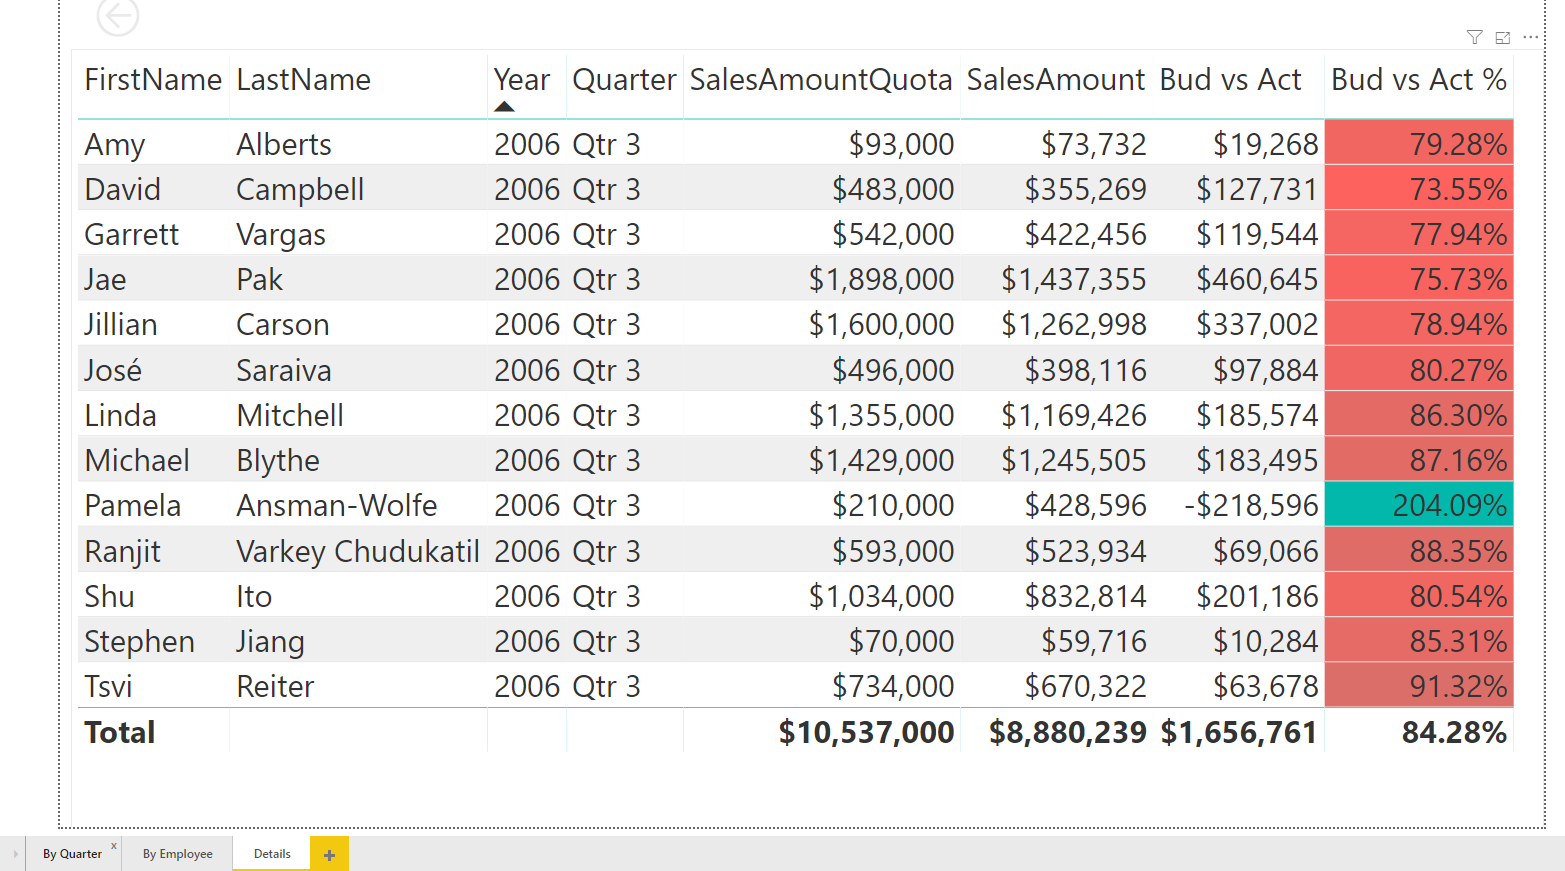
And the details which are a drill through from the other two pages;
Benefits of this Model
I showed you a fully-star-schema model design for Budget vs Actual in this article. Benefits of this model are basically all benefits of the star schema, including but not limited to:
- No extra relationship. Direct single relationship between each fact table and each dimension connected to it.
- No need for bi-directional relationship.
- No need for many-to-many relationship.
- No need for complicated DAX calculations.
- Fast performing model that answers the budget vs actual requirements.
Improvements
There are still things that can be improved in this model, for example, if you want to analyze data at a lower granularity than what you have, you need some extra consideration. For example; if you want to analyze budget vs actual on a daily basis (notice that the budget data is quarterly, not daily), then you would need some more calculations. I’ll talk about how to implement that in another article.
Summary
Star Schema is not for unrealistic and practice models, It works perfectly in real-world scenarios. My expertise is to come up with the proper model in all types of scenarios. When you have the proper model, your reporting solution would work fast, it would be scalable, and it would not have much difficulty in it. If you are thinking of a model, which you cannot think of a star schema for it, please let me know in the comments below, or contact me directly. before I forget;
I highly recommend you to read below articles as further study;
- What is the Relationship in Power BI?
- What is the Cardinality of the Relationship?
- What is the Direction of the Relationship?
- Data preparation; First and Foremost Important task
- What is a Dimension table and why say No to a single big table
- Basics of Modeling in Power BI: Fact Tables
- Combining Dimension Tables in Power BI using Power Query; Foundation of Modeling in Power BI
- Star Schema and How to Build It
- Creating a Shared Dimension Using Power Query and Power BI
- Build Your First Star Schema Model in Action


Reza is author of more than 14 books on Microsoft Business Intelligence, most of these books are published under Power BI category. Among these are books such as Power BI DAX Simplified, Pro Power BI Architecture, Power BI from Rookie to Rock Star, Power Query books series, Row-Level Security in Power BI and etc.
He is an International Speaker in Microsoft Ignite, Microsoft Business Applications Summit, Data Insight Summit, PASS Summit, SQL Saturday and SQL user groups. And He is a Microsoft Certified Trainer.
Reza’s passion is to help you find the best data solution, he is Data enthusiast.
His articles on different aspects of technologies, especially on MS BI, can be found on his blog: https://radacad.com/blog.