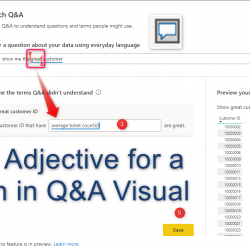
Q&A Visual – Define an Adjective for a Column
In the last post, I have explained how to work with Q&A visual . There is a way to define terms for the Q&N visual. There are two main terms Adjective Define an explanation for a column using a Measure. We able to define a measure as adjective for each columns of data. Columns Define Read more about Q&A Visual – Define an Adjective for a Column[…]