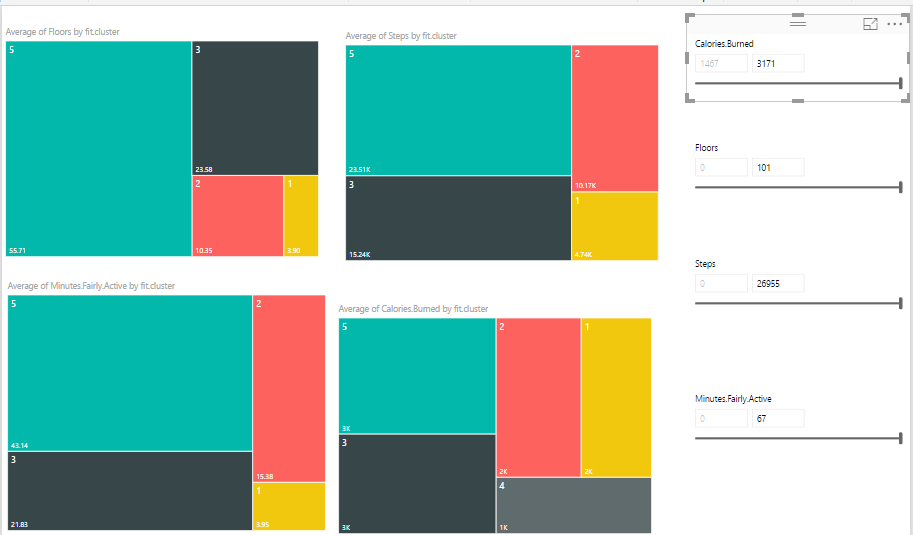
K-mean clustering In R, writing R codes inside Power BI: Part 6
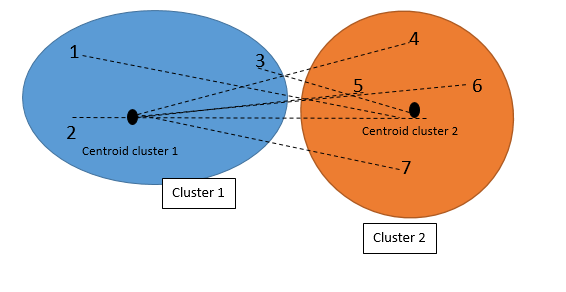
In the previous post,I have explained the main concepts and process behind the K-mean clustering algorithm. Now I am going to use this algorithm for classifying my Fitbit data in power BI. as I have explained in part 5, I gathered theses data from Fitbit application and I am going to cluster them using Read more about K-mean clustering In R, writing R codes inside Power BI: Part 6[…]