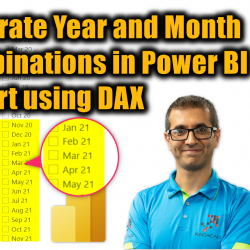
Explicit Vs Implicit DAX Measures in Power BI

Have you ever tried to connect to a Power BI dataset from Excel using Analyze in Excel? if yes, you might have had this experience that your values don’t show in Excel’s Pivot table as values. This is because those values are not explicit measures, they are implicit measures in Power BI. In this article Read more about Explicit Vs Implicit DAX Measures in Power BI[…]

All in One: Script to Create Calendar Table or Date Dimension using DAX in Power BI

I have previously written an article with the full script of how to generate a date dimension in Power BI using the Power Query script, and I would always recommend that as the first choice. However, sometimes, you just want this to be in DAX way, so here in this blog and video, I explained Read more about All in One: Script to Create Calendar Table or Date Dimension using DAX in Power BI[…]

Basics of DAX Expression in Power BI

There are a lot of resources about how to use each function. However, you always need to start with learning how the expression language works itself. You need to learn how to reference columns and tables. what operators can be used, and what are the very simple basics of writing a DAX expression. In this Read more about Basics of DAX Expression in Power BI[…]

DAX CrossFilter Function in Power BI: Write the Formula both-directional, but keep the relationship single-directional

If you are familiar with relationships in Power BI, you know that there are scenarios that you may need to change the direction of the relationship to a both-directional. A both-directional relationship comes at a cost, which is mainly performance and ambiguity of the model. There is a way to write a calculation in a Read more about DAX CrossFilter Function in Power BI: Write the Formula both-directional, but keep the relationship single-directional[…]

Power BI DAX RelatedTable Function: Get the subtable related to the current row

There are multiple functions that can help when you work with tables that are connected through relationships. One of these functions is Relatedtable. This function gives you the subtable from the other table for all the rows related to the current row. For example, all sales transactions (from the Sales table) for the current customer Read more about Power BI DAX RelatedTable Function: Get the subtable related to the current row[…]

Get a field value from a related table in Power BI: DAX RELATED Function Explained

Sometimes, in Power BI, you need to access a field’s value from another table that somehow is related to the existing table. You can use Power Query transformations such as combining Merge with something else. However, this can be needed when you write a DAX expression too. In this article and video, I explained a Read more about Get a field value from a related table in Power BI: DAX RELATED Function Explained[…]

FILTER Function in DAX and Power BI: Apply Custom Filter to Calculations

You can apply filtering to visualization elements. However, sometimes filtering has to be done on specific calculations. This can come in handy especially when you want to compare values of other items with specific items. In this article and video, I’ll explain how to use the FILTER function in DAX to apply a custom filter Read more about FILTER Function in DAX and Power BI: Apply Custom Filter to Calculations[…]

Month over Month Calculation in Power BI using DAX

When working with dates, one of the common types of analysis is period vs period, such as Year over year, and Month over month. In this article and video, I’ll explain how you can use DAX to write calculations for month-over-month simply in any Power BI report. Video What is a month-over-month calculation? Month over Read more about Month over Month Calculation in Power BI using DAX[…]

TOPN DAX Function: How it works in Power BI? Comparison against the top group

TOPN is a function in DAX that gives you the ability to select the top items from a table based on an expression. In this article and video, I’ll explain how to use the TopN function in DAX either to create a calculated table or to use it in a measure to achieve analysis such Read more about TOPN DAX Function: How it works in Power BI? Comparison against the top group[…]

Showing Ranking in a Visual in Power BI using RANKX DAX function

If you want to show the ranking in a Power BI visual, one way is to use a visual that supports that, such as a Ribbon chart. Another way, which is a more common way, is to write a calculation for rank, and RANKX is a DAX function that can help you with that. In Read more about Showing Ranking in a Visual in Power BI using RANKX DAX function[…]