Live Machine Learning in Azure Stream Analytics-part 1
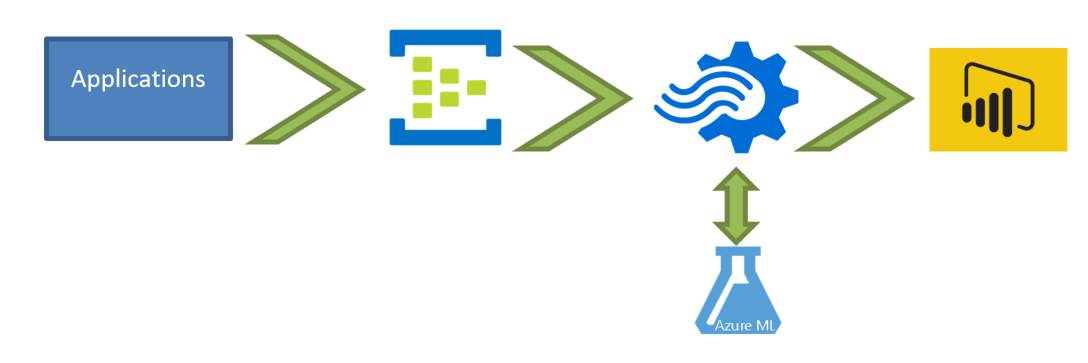
Azure Stream Analytics is an event-processing engine that allows users to analyze high volumes of data streaming from devices, sensors, and applications. Azure Stream Analytics can be used for Internet of Things (IoT) real-time analytics, remote monitoring and data inventory controls. However, Azure Stream Analytics is another component in Azure, that we were able to Read more about Live Machine Learning in Azure Stream Analytics-part 1[…]