Change The Font Size or Color Across All Visuals and Pages in a Power BI File
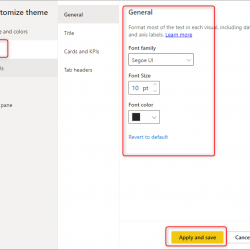
You can change the font size of a visual easily by going to the format option of that. However, if you want to change it for multiple visuals, better to use Themes for it. Recently Power BI Desktop came up with some easy-to-use options to customize your theme. That means you can now easily increase Read more about Change The Font Size or Color Across All Visuals and Pages in a Power BI File[…]