
Despite my many articles about the importance of star-schema and design principals of fact and dimension tables. I still get this question a lot: “When is good to combine tables vs loading them in the Power BI and creating a relationship between them?” This article is going to answer this question.
Relationships
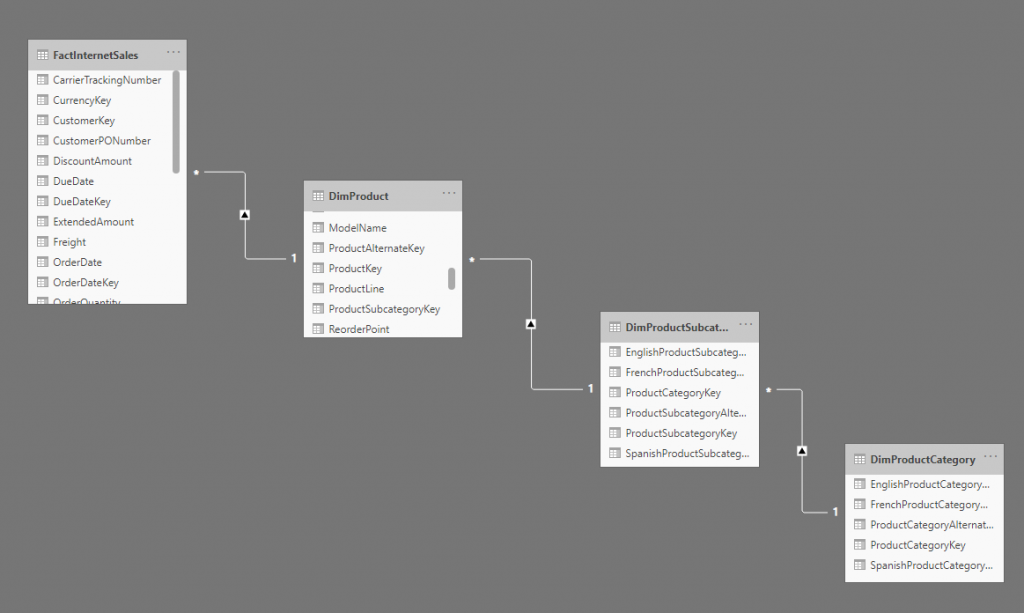
In Power BI models, you can load tables into the model, and create relationships between tables. The sample below is an example of that type of relationship;
To understand how the relationships work in Power BI, I recommend you to look at my articles here:
- What is the Relationship in Power BI?
- What is the Cardinality of the Relationship?
- What is the Direction of the Relationship?
- Active or Inactive Relationships
Combining tables
You can also combine some of those tables together and have a simpler model with fewer relationships, like the example below;
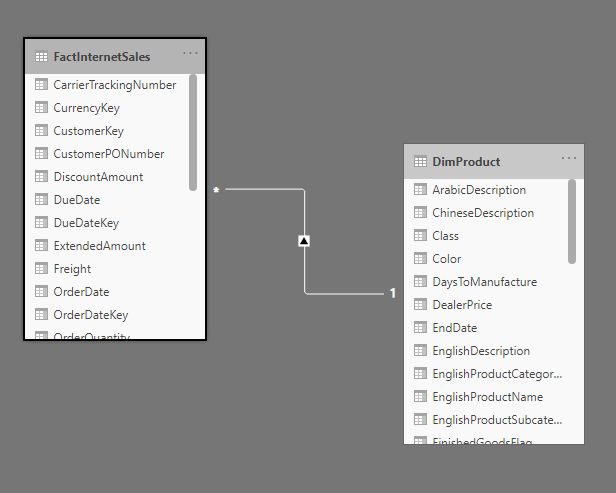
To combine tables with each other, you can use the Merge transformation in Power Query.
Relationship or Combined?
So the question for this article: Should you combine the Product, ProductCategory, and ProductSubcategory tables into one Product dimension? Or should you leave them as is, and create relationships between tables in the Power BI? Let’s talk about the pros and cons of each method.
Performance
One of the distinguishing features of a reporting system is the performance of it. If you are building a reporting system, and the loading the report takes five minutes, then what is the benefit of this report over doing it in the operational system? because it would have taken that much in the operational system anyway!
When you build a reporting system, you should target creating reports that load fast. Having extra relationships, doesn’t help with the performance. The DAX queries behind the scene would be longer.
If I have a visualization like this:
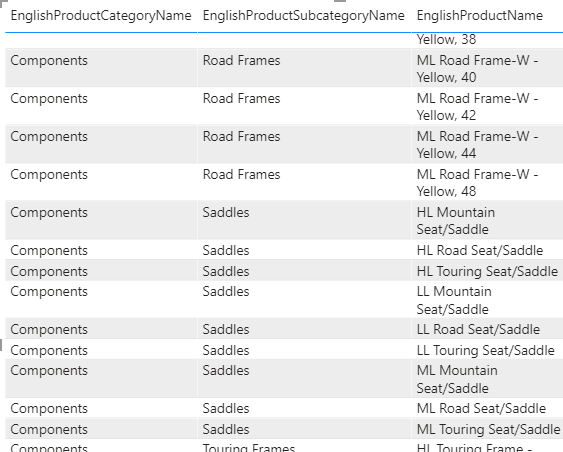
The DAX query generated by this visual is different when tables are combined, or when they are separated with relationships.
This is the DAX query when separated product tables with relationships:
// DAX Query
DEFINE
VAR __DS0Core =
SELECTCOLUMNS(
KEEPFILTERS(
FILTER(
KEEPFILTERS(
SUMMARIZECOLUMNS(
'DimProductCategory'[EnglishProductCategoryName],
'DimProductSubcategory'[EnglishProductSubcategoryName],
'DimProduct'[EnglishProductName],
"CountRowsDimProduct", CALCULATE(COUNTROWS('DimProduct'))
)
),
OR(
OR(
NOT(ISBLANK('DimProductCategory'[EnglishProductCategoryName])),
NOT(ISBLANK('DimProductSubcategory'[EnglishProductSubcategoryName]))
),
NOT(ISBLANK('DimProduct'[EnglishProductName]))
)
)
),
"'DimProductCategory'[EnglishProductCategoryName]", 'DimProductCategory'[EnglishProductCategoryName],
"'DimProductSubcategory'[EnglishProductSubcategoryName]", 'DimProductSubcategory'[EnglishProductSubcategoryName],
"'DimProduct'[EnglishProductName]", 'DimProduct'[EnglishProductName]
)
VAR __DS0PrimaryWindowed =
TOPN(
501,
__DS0Core,
'DimProductCategory'[EnglishProductCategoryName],
1,
'DimProductSubcategory'[EnglishProductSubcategoryName],
1,
'DimProduct'[EnglishProductName],
1
)
EVALUATE
__DS0PrimaryWindowed
ORDER BY
'DimProductCategory'[EnglishProductCategoryName],
'DimProductSubcategory'[EnglishProductSubcategoryName],
'DimProduct'[EnglishProductName]
If tables are combined, the code is like below:
// DAX Query
DEFINE
VAR __DS0Core =
SUMMARIZE(
'DimProduct',
'DimProduct'[EnglishProductCategoryName],
'DimProduct'[EnglishProductSubcategoryName],
'DimProduct'[EnglishProductName]
)
VAR __DS0PrimaryWindowed =
TOPN(
501,
__DS0Core,
'DimProduct'[EnglishProductCategoryName],
1,
'DimProduct'[EnglishProductSubcategoryName],
1,
'DimProduct'[EnglishProductName],
1
)
EVALUATE
__DS0PrimaryWindowed
ORDER BY
'DimProduct'[EnglishProductCategoryName],
'DimProduct'[EnglishProductSubcategoryName],
'DimProduct'[EnglishProductName]
The second code is much simpler. And it would perform faster when you have many large tables.
Simplicity vs a Mess
Another big deterministic of a good reporting model is the ability to make it easy-to-understand for data visualizers. If a data visualizer have 500 tables in a model all inter-related, he/she would have a hard time to understand the model.

Having a few tables and relationships is always helpful to make the model simple to understand.

Complexity of the relationship
Relationships come with a cost of complexity. You might need a both-directional relationship sometimes, or you might get into the problem of having an inactive relationship and trying to resolve that. Less relationship means fewer problems of this type when it is unnecessary.

Avoid this trap: A big table including everything
The above items might lead you to the thinking that if you have no relationship at all, then your model is the best. No, It is not. If you combine everything in one table, you will have other problems.
When everything is in one big table, then changes would become really hard. Every new table should be combined with the other tables. What if there is a table that you want to use in multiple Power BI files? how you want to re-produce the steps to generate that table when everything is part of one big table?
Star-Schema
Here is the answer to the question of this article. You should not have tons of relationships, and you should not create one big table with everything in it. So what is the solution then? The answer is to design a totally different schema. A new layout of tables and relationships. Something that is different from the operating system’s database. Something that helps to get the best of both worlds.
This model, has many names; dimensional model, star schema, data warehouse etc. Through the process of creating this model, you combine some of the tables (dimensions), and keep some of them to be connected through the relationships (dimension to fact table relationships).
Build it from your existing tables
What if you don’t have a reference table that you can use as a dimension? what if there are only mapping tables in your data source? Many, have faced the same challenges. If you don’t have a reference table, you can create them from your mapping tables.
Here is an example, in which I explained how you can build reference (dimension) tables;
Just because you can, it doesn’t mean you should
Just because you can load all the tables into the model and then create relationship, it doesn’t mean it is the best thing to do. Just because you can merge all the tables using Power Query, it doesn’t mean you should do it.
The process of data modeling is not based on CAD DOs, it is based on SHOULD DOs.
Power BI modeling starts with a pen and paper
This is very important that you start your modeling by a pen and paper. Yes, no tools or services needed. Just a pen and paper. You need to draw the dimensional model, the layout of the tables. You need to list fields in your dimension and fact tables. All of these are much better to be done using a pen and paper. You can then take the next step of implementing it using Power BI.

A good model
A good model should consider many things. It should first start with the requirement. How are you going to build a database diagram of a reporting system, when you don’t know what values should be shown in the report?
A good model also requires an understanding of the existing data, and how that data can be transformed into the star-schema model.
Don’t build your model on this rule that; this is the format that I get data, so can’t really do much about it. This is wrong! You need to transform that format.
My report works just fine, why bother?
Why bothering if your report is running just fine? or if it doesn’t have any performance problems? Do you really need to think about the model if you got only a few tables and everything works as it should? Why spending time on something that the users won’t see?
Yes, you need to work on your model. If you didn’t do that from the beginning of your implementation, do it now. Your model gets bigger and bigger every time. You will have more tables, more relationships, bigger challenges.
Building a proper data model is like building a base for a 100 stories building. would you first build the 100 stories and then come and fortify the base?! of course not. You should do it as soon as possible, or your whole building might collapse at some point.

Your model, your world
Your Power BI data model is your world. It is up to you to decide in which world you want to live in. Do you prefer to live in a model that is too complicated that every time someone asks for a change it ends up with hours and often days of work because it is not designed in the way it should? Or do you prefer to build a model that is a high performance, simple, easy to change, and simple to integrate? That is your choice; your model, your world.


Reza is author of more than 14 books on Microsoft Business Intelligence, most of these books are published under Power BI category. Among these are books such as Power BI DAX Simplified, Pro Power BI Architecture, Power BI from Rookie to Rock Star, Power Query books series, Row-Level Security in Power BI and etc.
He is an International Speaker in Microsoft Ignite, Microsoft Business Applications Summit, Data Insight Summit, PASS Summit, SQL Saturday and SQL user groups. And He is a Microsoft Certified Trainer.
Reza’s passion is to help you find the best data solution, he is Data enthusiast.
His articles on different aspects of technologies, especially on MS BI, can be found on his blog: https://radacad.com/blog.
Great article Reza. Thanks for sharing such important details.
Thanks, a very timely article for me. I do have a question. In my case I have a fact with 2 date columns that represent when somebody bought a service and when that service is supposed to be rendered (bought date, service date). This typically needs to be aggregated to a calendar week, month, quarter (wmq). But because I have 2 dates – should I
1. combine WMQ into my fact for each date (bought date and service date)
2. Use a relationship on one and combine the columns for the other (I know, 90% of the time, they will filter by bought date but perform aggregations on service date)
3. Create a copy of my calendar and relate both columns?
TIA
Hi Raj
I would create a copy of the calendar table, we call it a role-playing dimension, which I explained here.
and for the other part that you have weekly data, I wouldn’t aggregate the calendar table, instead I would use the first or the last date of the week in the fact table to connect to the normal calendar table. I explained about having fact tables with multiple granularities in this example.
Cheers
Reza
Hi Reza
I come from Cognos and SSRS background and am fairly new to power bi.Just one stupid question.
If you have 3 tables A B and C linked in model tab what query is fired in the background?
1.Does power bi create an inner join between A,B and C ?
2.Or no joining is involved only data is filters from one direction to another?
Regards
Imran
Hi Imran
It depends on the data source and if the query folding happens or not. If query folding happens, yes, a join statement sent to the database.
Cheers
Reza