
Most of the time, you would like to know how the data quality looks like in your tables. Although, this is a process that you mainly check at the time of data preparation, having such report for end users, is also helpful, because sometimes they see an odd outcome, and wonder where this is coming from. A data profiling report tab in your Power BI report tells them more about your data, and if there are any anomalies in it. In this article, I will show you an easy way to build a data profiling report in Power BI. If you like to learn more about Power BI, read Power BI book from Rookie to Rock Star.
What is Data Profiling?
Data profiling is the process of understanding more about the data. Any information that can help to understand the data would be helpful. For example, you probably like to know how many unique values you have in the column, what is the minimum values, what is the maximum, the average, standard deviation and etc. This is what Data Profiling will provide for you.
Profiling in Power Query Editor
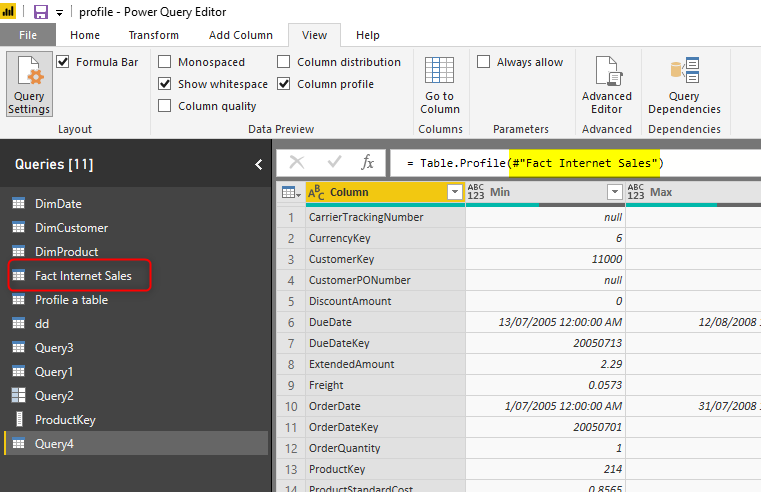
There is a data profiling section in Power Query Editor, which helps at the time of data preparation to understand the nature of the data. This can be done by selecting the Column Profiling and Quality and Distribution details in the View tab of the Power Query Editor of Power BI Desktop.
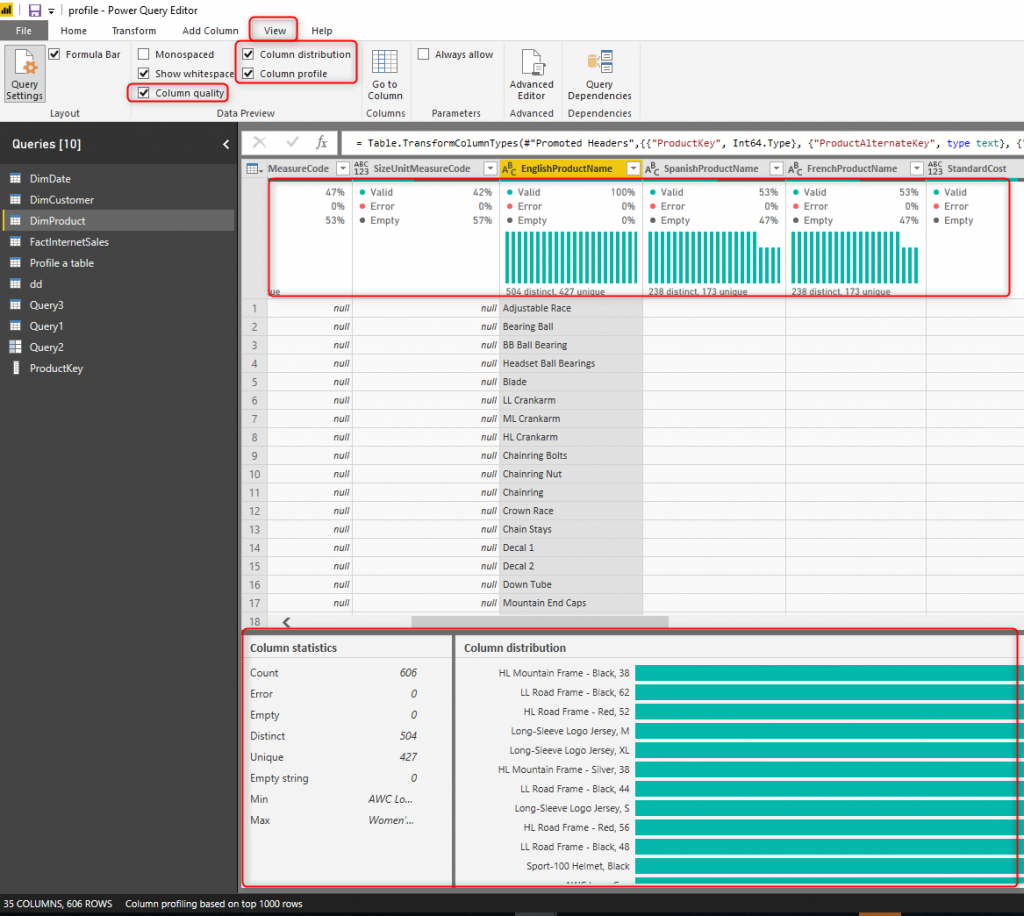
The profiling data is great, but unfortunately not available for end users. I’m going to show you how to get that details as a report to the end user.
Power Query Function: Table.Profile
Table.Profile is a Power Query function that processes a table and gives you a table of all columns and data profiling information of those columns. Here is how Table.Profile function works;

Using Table.Profile
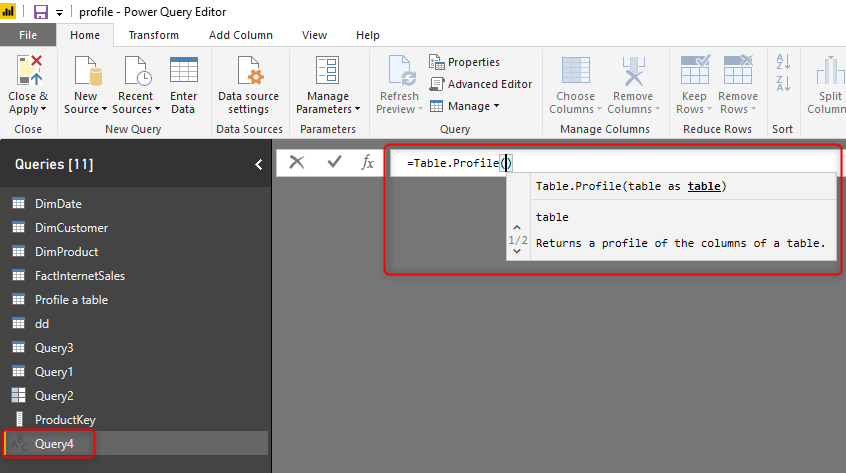
To see how the function works, you can start with a New Source in Power Query Editor, and then Blank Query;

In the new blank query, in the formula bar (if you don’t see the formula bar, check the formula bar option in the View tab of the Power Query Editor), type below expression:
=Table.Profile()
Note that this code is not complete yet, we need to provide a table as the input of this function.
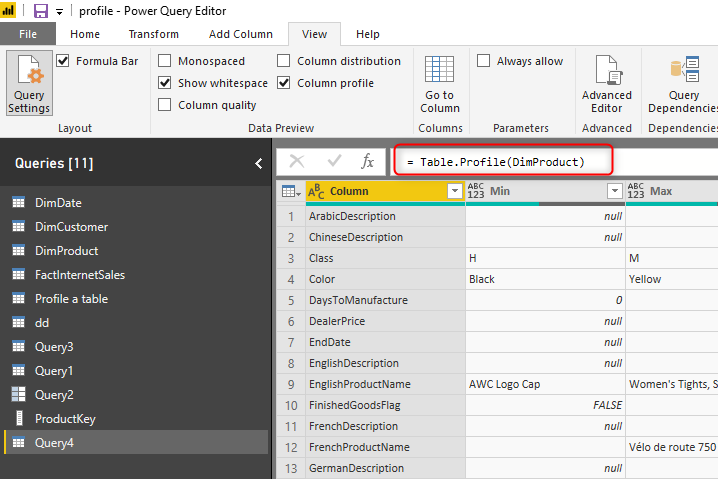
Note that everything in Power Query is case sensitive when you type something. Type the table name inside the bracket. like below:
If the table name has space or any special characters in it, then you should follow the rule of variable namings for it, and put that inside double quote with a # at the beginning, for example, Fact Internet Sales should be written like below;
The good thing is that the intellisense is sometimes helpful, and you can just select the item from there.
The Profiling Data
The profiling data that you get from Table.Profile function is like below;
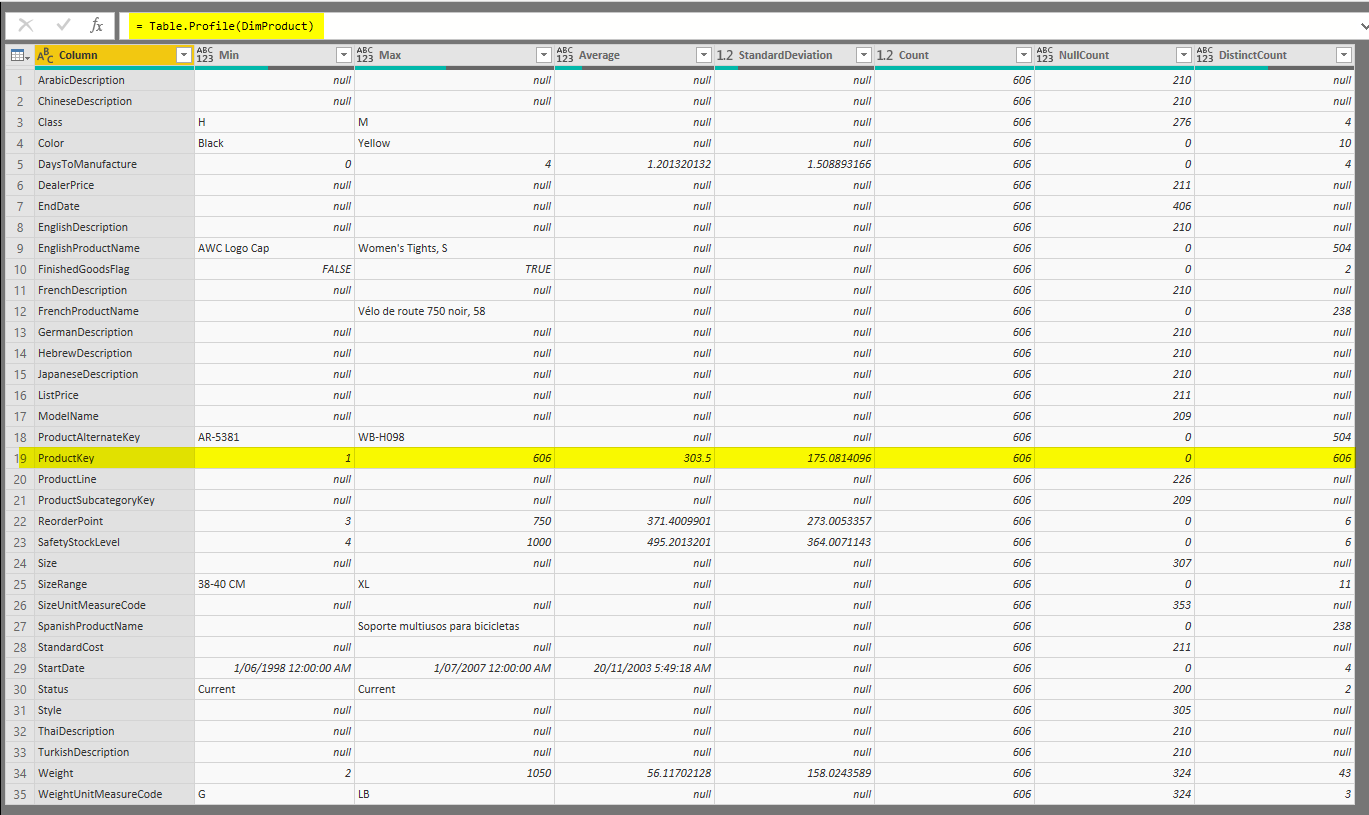
This will give me the list of all columns in the table, one at each row, and the information such as minimum value, maximum, average, standard deviation, count, null count, and distinct count. Great! Now we have this data as a table in Power Query, and that means we can load it into Power BI, You can call this query Data Profiling or something like that, then Close and Apply the Power Query Editor window to load it into the Power BI.
Data Profiling Report
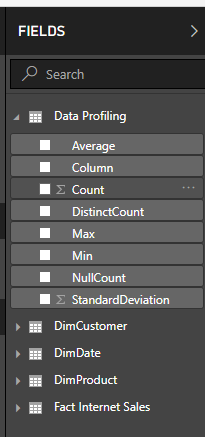
After loading the data into Power BI, you’ll have the table with all columns, and it can be used in any visuals. I prefer to have a tab in my report (report page) named Profiling report with all details needed.
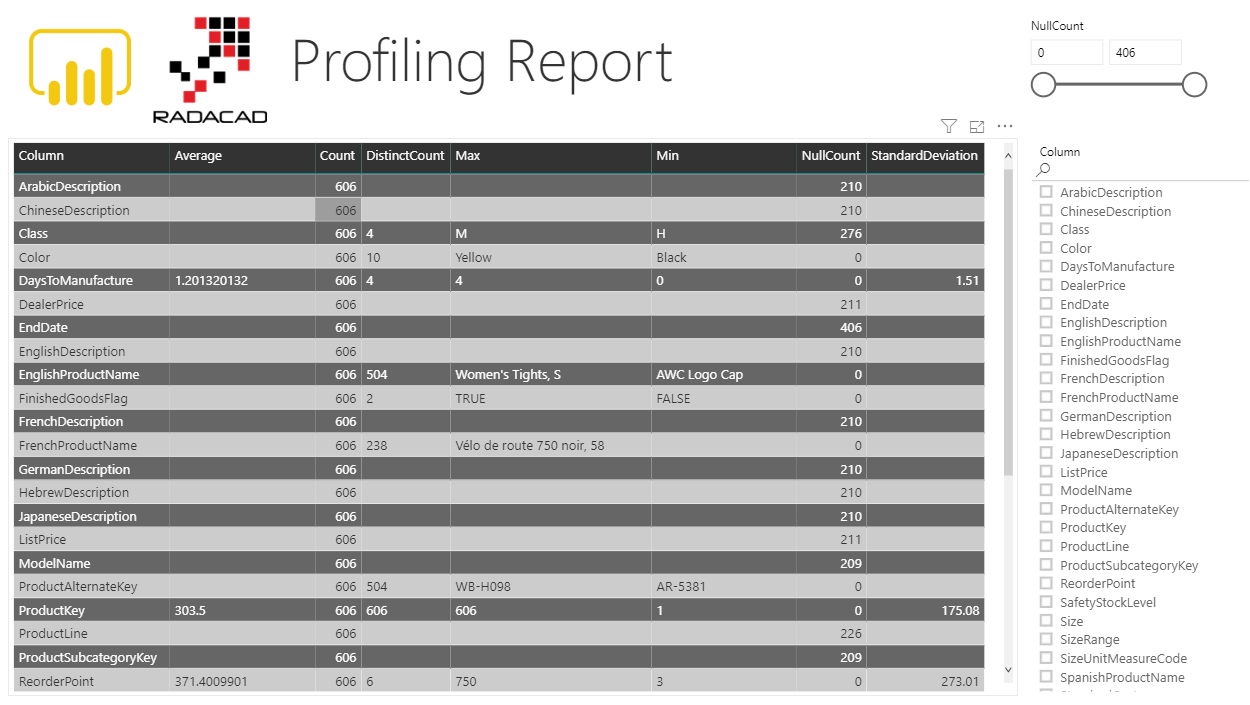
The rest of it is playing with visuals and slicers to give you the visualization of the data profiling in the report. Here is a simple example I built;
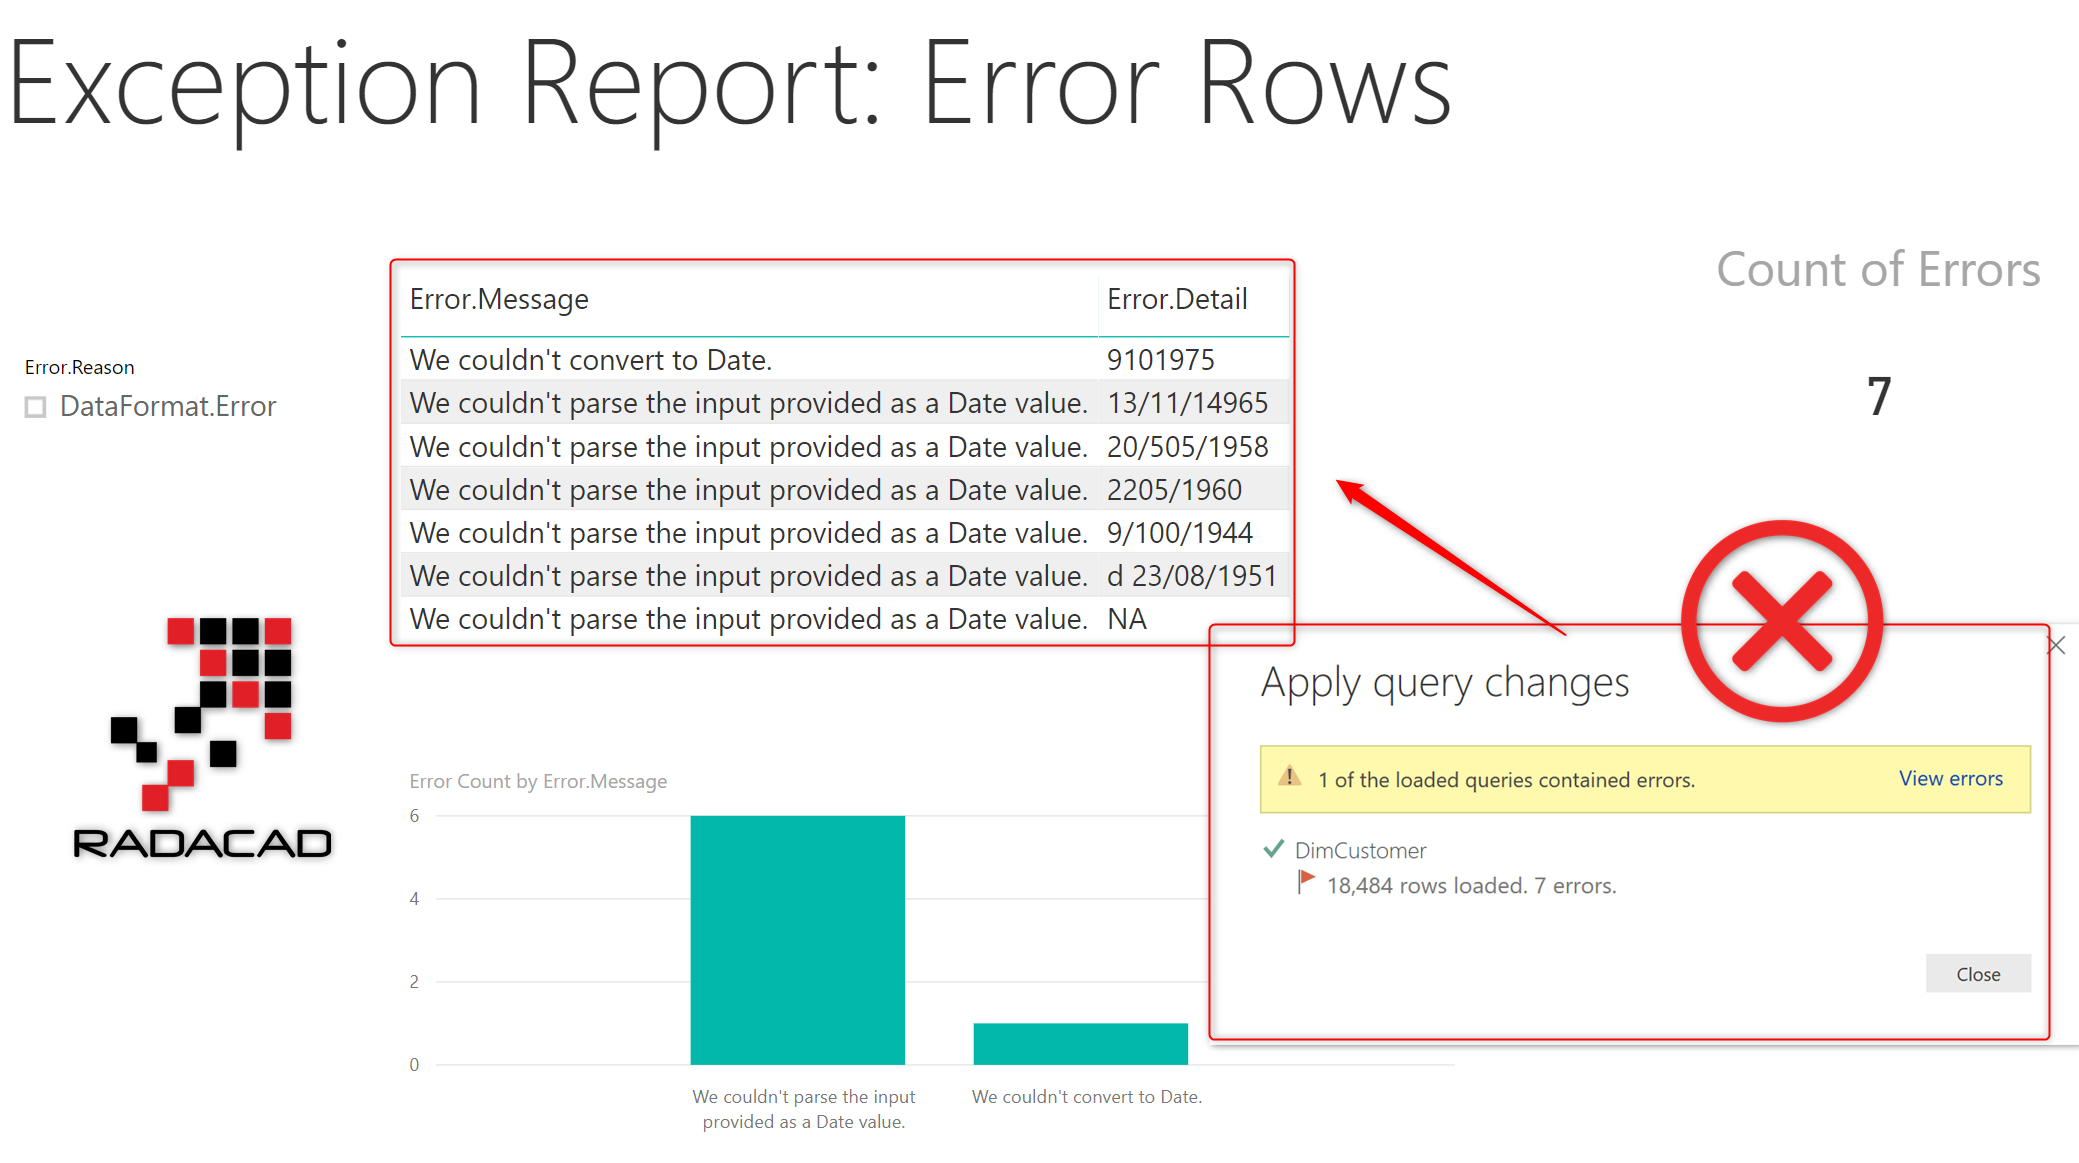
Enhance it more with Exception Report
Data profiling report is good to understand the nature of the data. However, it would be more complete, if you add also the Exception report in it. I have explained in three articles about how to do that, and here is where to start:
Summary
Information about the data in each column and each table is useful information some time to be shared with the end user. In this article, you learned that using Table.Profile function, you can fetch this information, and then load it into Power BI, and visualize it in the report. For a real-world error proof and comprehensive Power BI report, I do always recommend bringing the profiling report and the exception report in your implementation.


Reza is author of more than 14 books on Microsoft Business Intelligence, most of these books are published under Power BI category. Among these are books such as Power BI DAX Simplified, Pro Power BI Architecture, Power BI from Rookie to Rock Star, Power Query books series, Row-Level Security in Power BI and etc.
He is an International Speaker in Microsoft Ignite, Microsoft Business Applications Summit, Data Insight Summit, PASS Summit, SQL Saturday and SQL user groups. And He is a Microsoft Certified Trainer.
Reza’s passion is to help you find the best data solution, he is Data enthusiast.
His articles on different aspects of technologies, especially on MS BI, can be found on his blog: https://radacad.com/blog.
Helpful feature!
Thanks for this interesting post. This has lead me to explore this a touch further. Another useful complimentary function Table.Schema – This provides a touch of detail on the column datatypes and a few other bits and pieces.
I came up with this function today which will produce a full analysis report of all tables in the PBI Dataset. The function parameter will be the name of the query where the function is being called from to remove the circular reference (I was struggling to remove this via error handling, however filtering it out early made major performance improvements)
(SelfQueryName as text) =>
let
Source = #sections, // Grabs all Queries in the Report
Section1 = Record.RemoveFields( Source[Section1], SelfQueryName), // Removes the Self Referencing Query
ConvertAllTablesToTable = Record.ToTable(Section1), // Converts Record Query to a Table
RenameTableColumn = Table.RenameColumns(ConvertAllTablesToTable,{{“Name”, “Table”}}), // Column name to identify the Tables
AddProfiling = Table.AddColumn(RenameTableColumn, “Profiling”, each Table.Profile([Value])), // Adds the Profiling Info
RemoveNonTables = Table.RemoveRowsWithErrors(AddProfiling, {“Profiling”}), // Remove Non-Table Queries (Functions, Lists etc)
AddSchema = Table.AddColumn(RemoveNonTables, “Schema”, each Table.Schema([Value])), // Adds the Schema Info
IdentifyNonRowTables = Table.AddColumn(AddSchema, “Custom”, each Table.IsEmpty([Value]), type logical), // Identify Tables without Rows (ie, Measure Tables)
FilterNonRowTables = Table.SelectRows(IdentifyNonRowTables, each ([Custom] = false)), // Removes tables without Rows
MergeProfileWithSchema = Table.AddColumn(FilterNonRowTables, “JointTable”, each Table.NestedJoin([Profiling], {“Column”}, [Schema], {“Name”}, “Query1”, JoinKind.LeftOuter), type table), // Combines Schema and Profile Data
RemovePrepColumns = Table.RemoveColumns(MergeProfileWithSchema,{“Value”, “Profiling”, “Custom”, “Schema”}), // Remove Intermediary Columns
ExpandColumnNames = {“Column”, “Min”, “Max”, “Average”, “StandardDeviation”, “Count”, “NullCount”, “DistinctCount”, “Query1”}, // Expand Profile Data Column Names
ExpandJointTable = Table.ExpandTableColumn(RemovePrepColumns, “JointTable”, ExpandColumnNames, ExpandColumnNames), // Expand Profile Data
ExpandSchemaColumnNames = {“Position”, “TypeName”, “Kind”, “IsNullable”} , // Expand Schema Column Names
ExpandSchemaTable = Table.ExpandTableColumn(ExpandJointTable, “Query1”, ExpandSchemaColumnNames, ExpandSchemaColumnNames), // Expand Schema Columns
ChangeOutputDataTypes = Table.TransformColumnTypes(ExpandSchemaTable,{{“IsNullable”, type logical}, {“TypeName”, type text}, {“Kind”, type text}, {“Position”, Int64.Type}, {“DistinctCount”, Int64.Type}, {“NullCount”, Int64.Type}, {“Count”, Int64.Type}, {“StandardDeviation”, type number}, {“Column”, type text}}) // Tidy Output Column Types
in
ChangeOutputDataTypes
Hi Tim,
Yes, Table.Schema is another useful function I do use.
However, the script you mentioned, isn’t working when you load it into Power BI, It only works in Power Query Editor.
because #shared and #sections won’t reveal other queries after the load of the data
Cheers
Reza
That function works for me in Power BI. Thanks
How did you get it to work in Power-Bi. The function for me only works in power-query
can you paste your M code here?
Is there a way to show the value distribution as a tooltip?
Very good question.
I wrote about it here in another article.
Cheers
Reza
Thank you so much, Sir, as well as your team.