
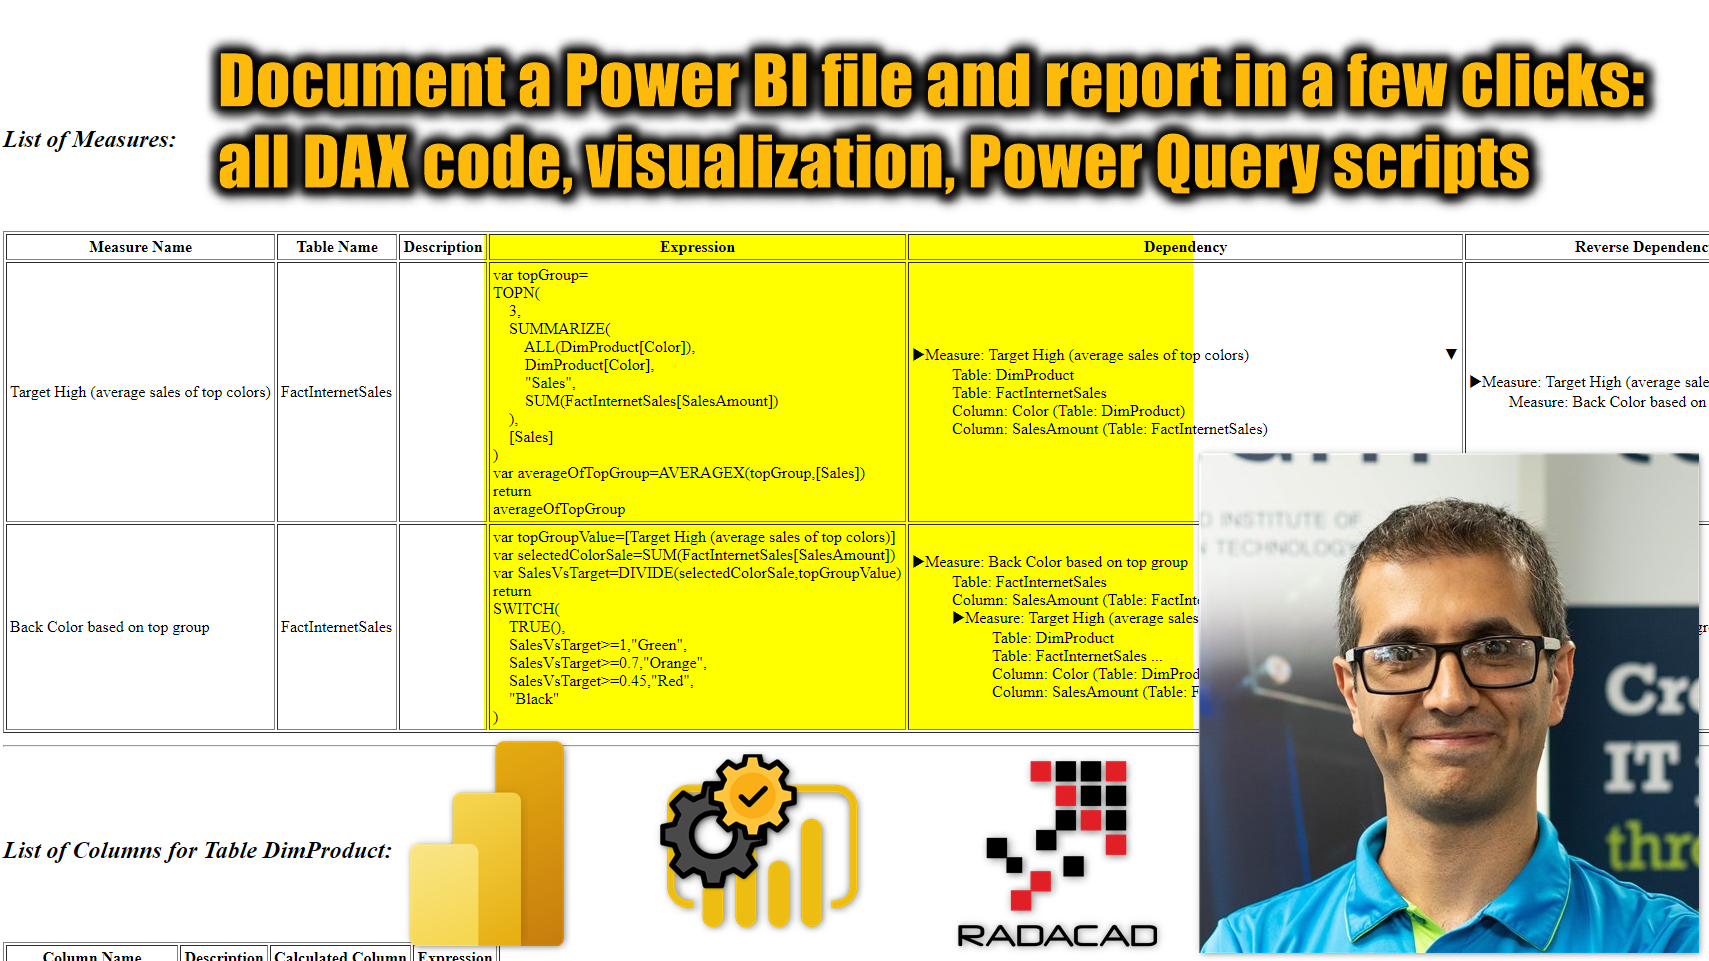
In this article and video, I’ll share with you how to document everything from a Power BI file in a few clicks. The document output will have all the DAX code (measures, columns and tables) with the expressions, the tables with the Power Query scripts, information about visualization such as how many pages, bookmarks, visuals in each page, and even what tables or columns used or not used in visualization. All in just a few clicks.
Video
Power BI Helper; Download and install for FREE
If you haven’t done it already, download and install the Power BI Helper, it is a free application to use and you can use it for many useful things to do with the development of the Power BI reports as well as the documentation. Here you can download it: https://powerbihelper.org/
Open Power BI Helper as an external tool
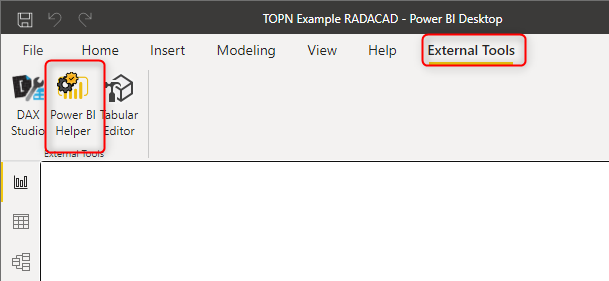
After the install, while you have the Power BI file open in the Power BI Desktop, go to the External tools tab and click on Power BI Helper to open it (Alternatively you can open it from the Start and programs on your windows machine);
Connect to Model
Once the Power BI Helper is open, click on Connect to Model (Make sure that the Power BI file is already open in the Power BI Desktop).
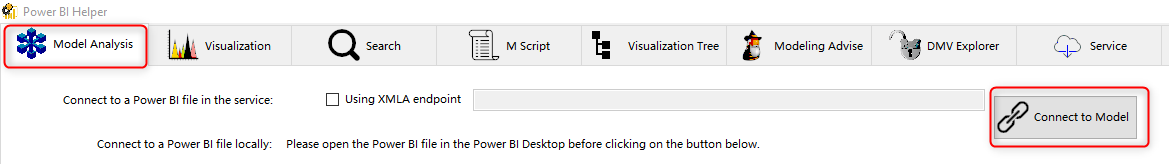
This option will detect all the instances of Power BI files open in the desktop, and will list them in a dropdown. you can choose the one you want to document.

If you have only one Power BI file open, the dropdown will just show that one. The rest of the page shows information about the model. Information such as all the tables, the columns and the measures with their expressions and expression trees.
Visualization information
Power BI Helper should automatically find all the visualization information of the selected model, and shows you the information in the Visualization tab.
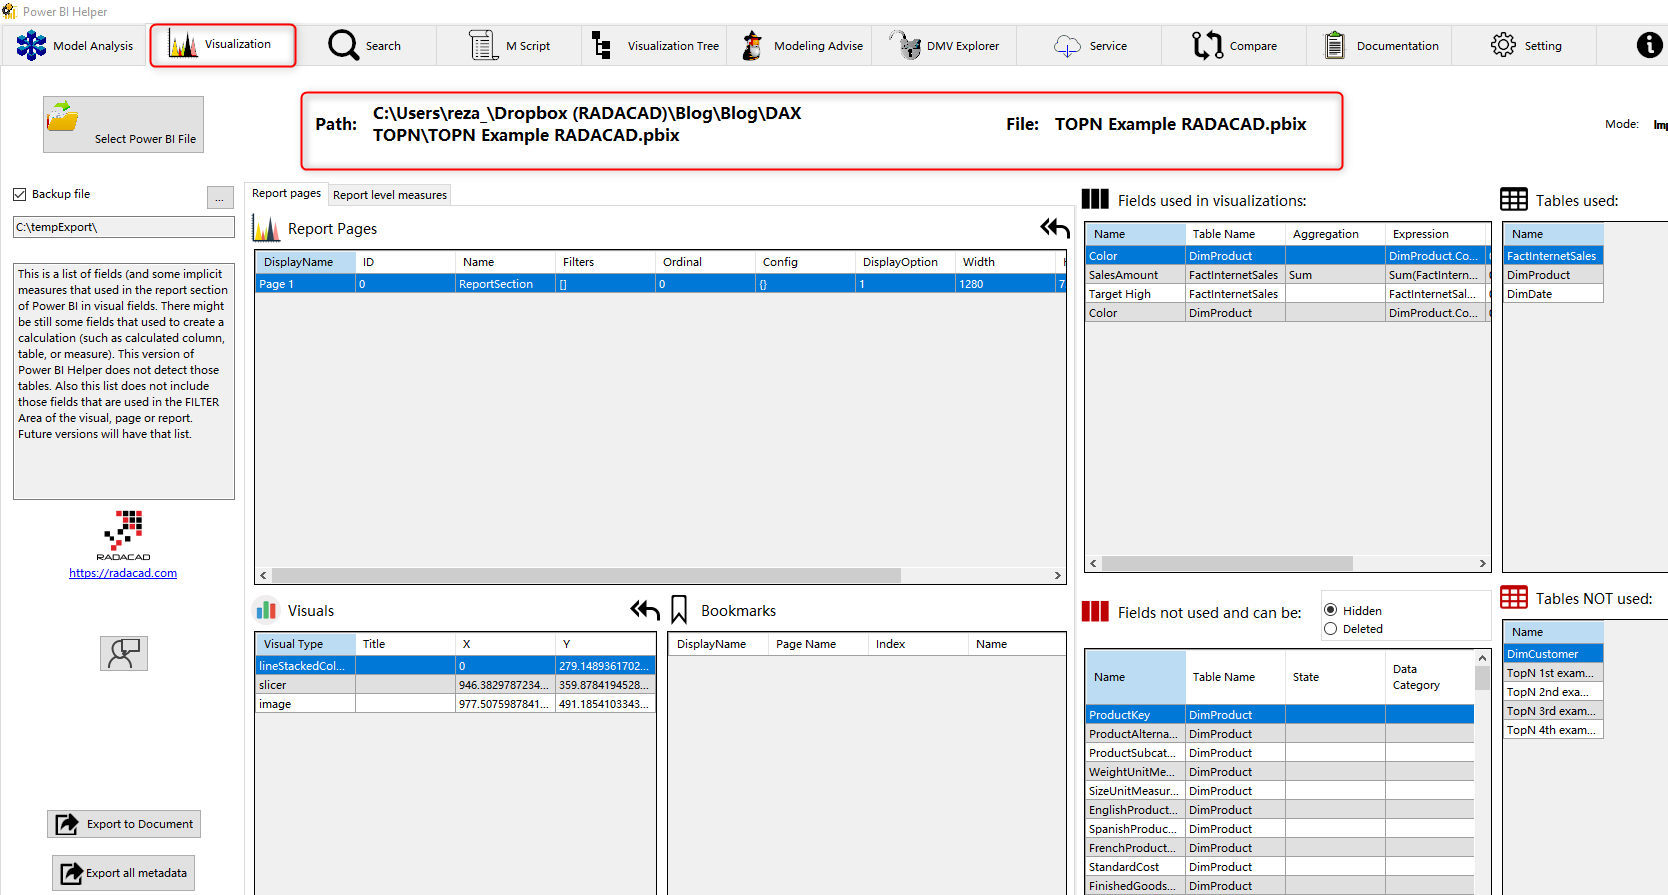
There are a few cases that Power BI Helper doesn’t show the visualization information automatically (for example; if the Power BI file is just generated and is not yet saved). In those cases, you can use the Select Power BI File option to choose the file from the location it is saved.
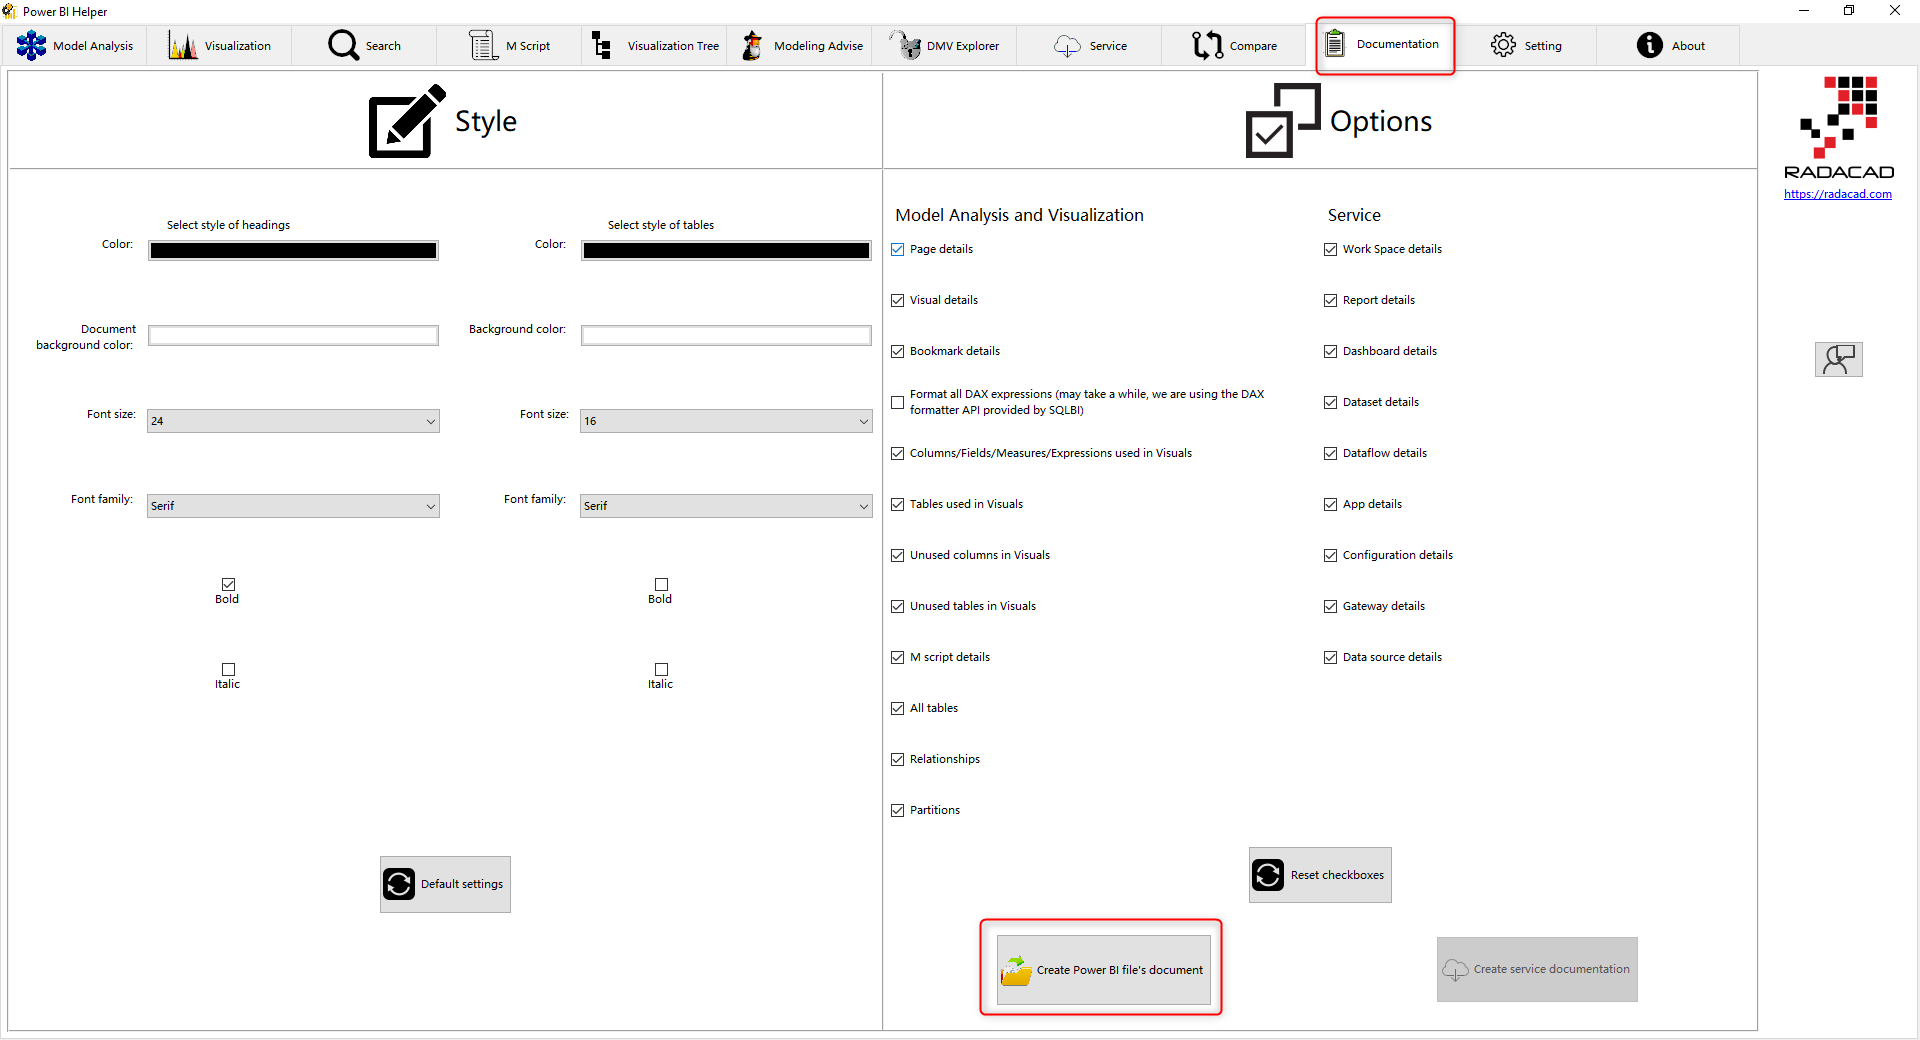
Documentation
Now you are just a click away from the documentation (this is in fact the second click you did after opening Power BI Helper), In the Documentation tab, click on the Create Power BI file’s document.
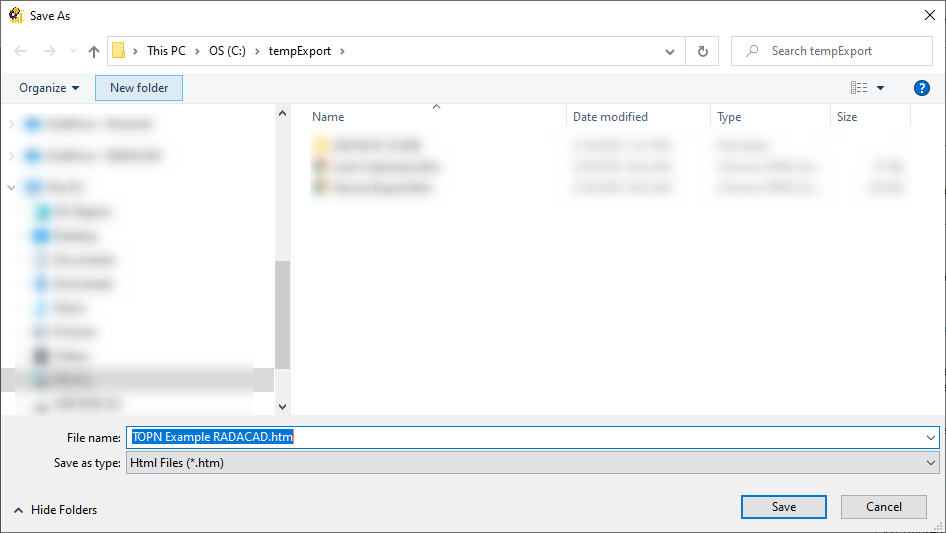
Choose the location for the documentation file (which is of HTML type);
And that’s it, now you can open the documentation, here is an example of a documentation file:
What is included in the documentation?
As you see in the above, the documentation includes many information. here are some of the information available in the output document generated;
- File name, path, the date of documentation
- all visualization pages and their details
- all visuals in every page with their details
- all the bookmarks and which pages the bookmarks are bound to.
- all the columns, and measures used in Power BI visuals
- all the tables used in Power BI visuals
- all the columns, tables, and measures NOT used in Power BI visuals (good source to clean up, although Power BI helper can do that for you in a few clicks)
- all the tables in the model with their details. If they are calculated tables, their DAX expression will be there too.
- all the measures with their DAX expressions, with also two tables of dependency tree and reverse dependency tree (both useful to detect where the measure is used, or what other fields/tables/measures used in the expression of this measure).
- all the relationships and their details
- all the roles (defined for row-level security) and their expressions
- report level measures if there is any
- …
Configurations
As you have seen, the documentation was just a few clicks and easy-to-do. If you want to configure the output document, you can do that in the Documentation tab, in two main sections;
Configure the style of the documentation
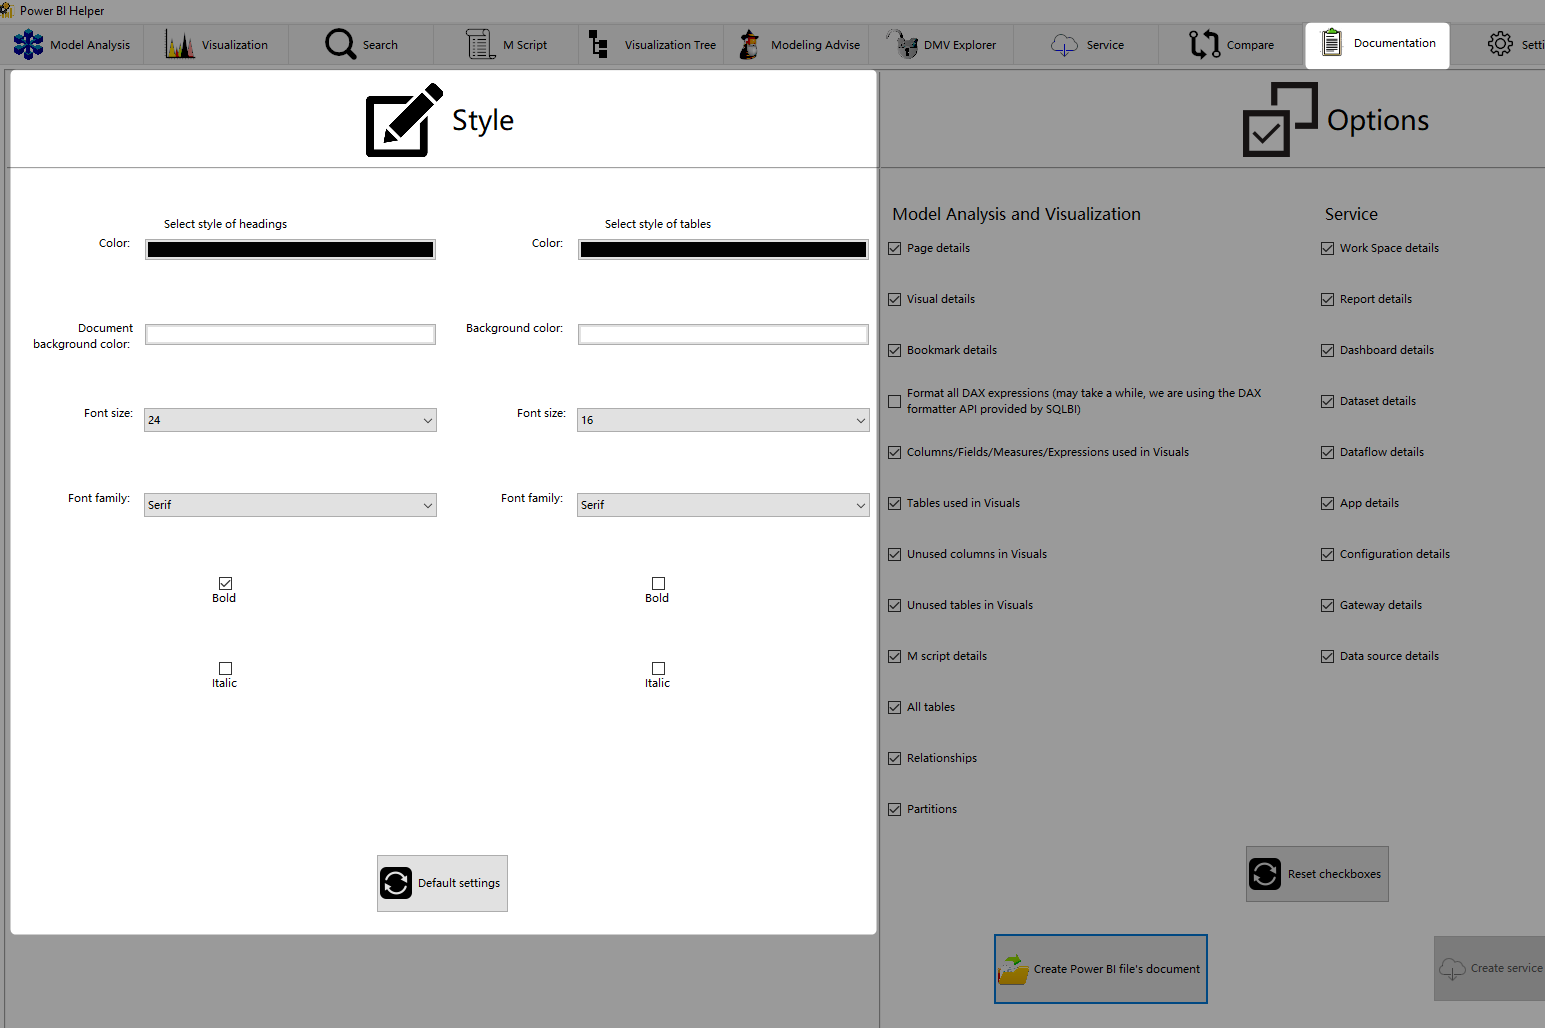
The style configuration are about fonts, colors, sizes of tables, headings and other parts of the generated document.
Sections and information to document
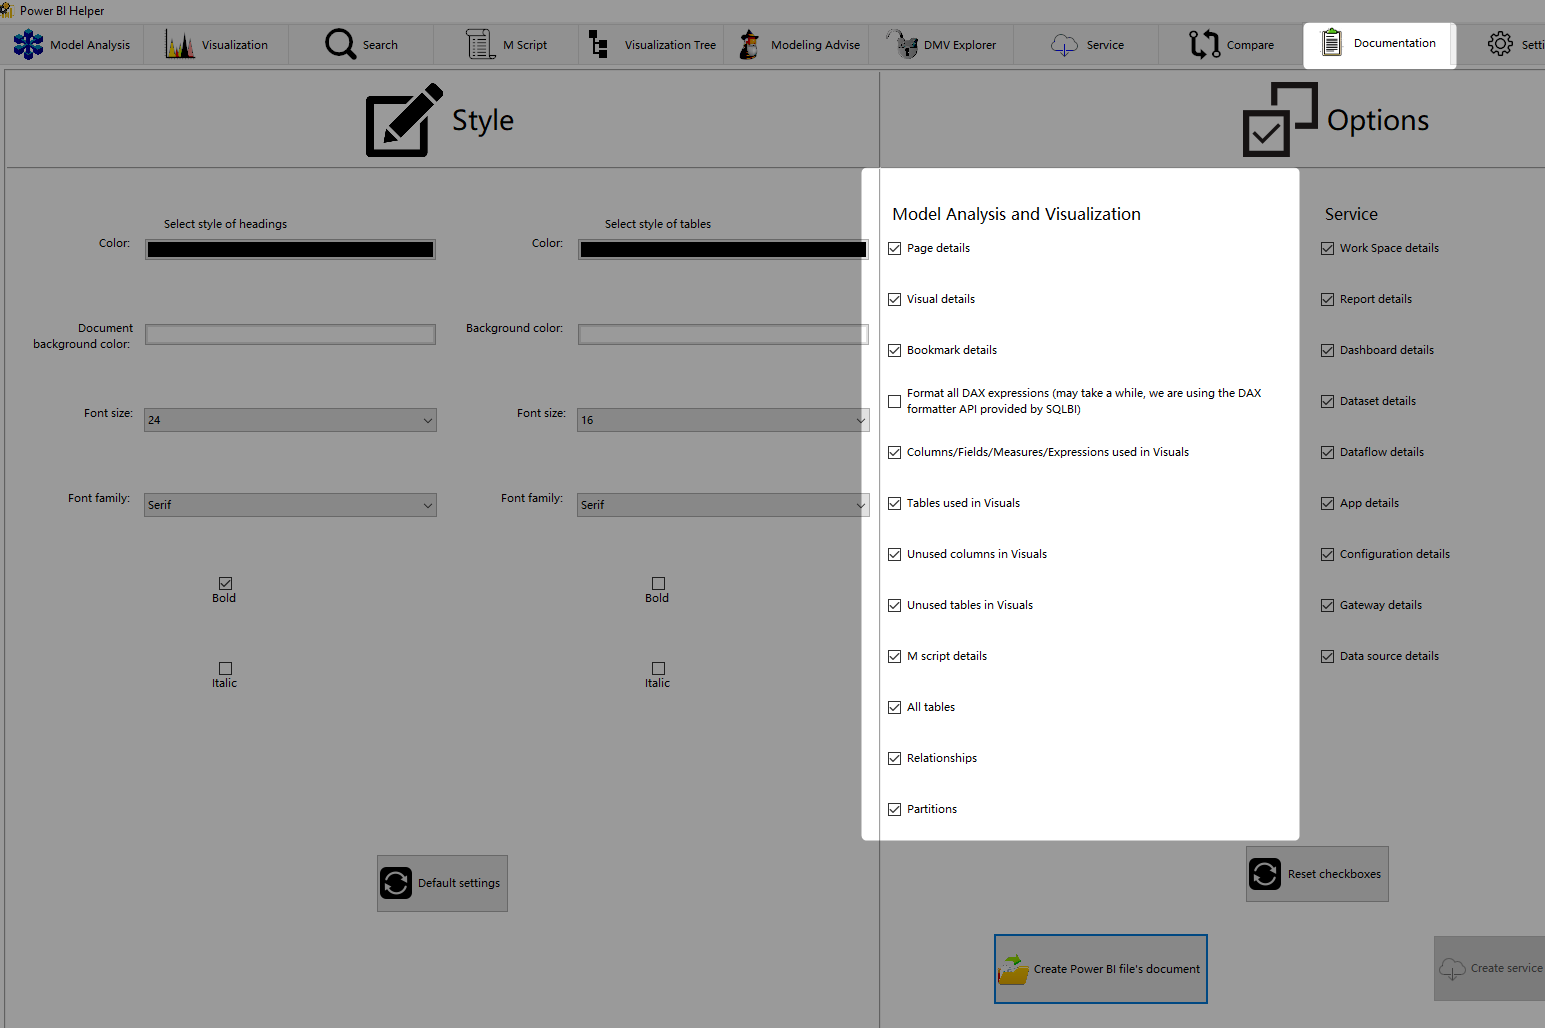
You can choose what information you want to document from the Power BI files. We recommend keeping them all selected for the full documentation. There is an option to format all the DAX expressions before documentation, this option uses the beautiful DAX formatter service from our friends at SQLBI, and if you use it, you have to remember that every measure’s expression will be sent to an API and the result of that will come back, if you have too many DAX expressions, this will slow down the documentation process.
Checkout Power BI Helper for other useful things
Power BI Helper can also help you to document the entire objects in the Power BI service. That part is very comprehensive that I’ll explain in another article and video. Power BI Helper also helps you to performance tune, and reduce the size of your Power BI file, clean up your model, export both data and metadata of the Power BI. In general, it helps you to have a better Power BI development experience. Check out more what you can do with this tool.


Reza is author of more than 14 books on Microsoft Business Intelligence, most of these books are published under Power BI category. Among these are books such as Power BI DAX Simplified, Pro Power BI Architecture, Power BI from Rookie to Rock Star, Power Query books series, Row-Level Security in Power BI and etc.
He is an International Speaker in Microsoft Ignite, Microsoft Business Applications Summit, Data Insight Summit, PASS Summit, SQL Saturday and SQL user groups. And He is a Microsoft Certified Trainer.
Reza’s passion is to help you find the best data solution, he is Data enthusiast.
His articles on different aspects of technologies, especially on MS BI, can be found on his blog: https://radacad.com/blog.
Hello, just wanted to ask you if this external tool will read information from a power bi desktop file that used an imported dataset (feature used through Data – connect to existing Datasets)? Thanks
Hi.
Power BI Helper supports all types of connections: Import data, DirectQuery, Live Connection, and Composite Model
Cheers
Reza
hi and thank you for this great tool. i tried and it rocks although for a reason which i don’t know, I am trying to create documentation for a report but the button is grayed and i don’t have an option to create.any idea why or when this happening? thank you
Thanks for your feedback. Please send an email to training@radacad.com with the sample file and we will investigate
Cheers
Reza
Is the any way that I can save the documentation as csv or excel?
That is in our backlog, wait for it please:)