

Have you ever tried to connect to a Power BI dataset from Excel using Analyze in Excel? if yes, you might have had this experience that your values don’t show in Excel’s Pivot table as values. This is because those values are not explicit measures, they are implicit measures in Power BI. In this article and video, I’ll explain the difference between these two types of measures in Power BI and the impact on the user.
Video
Sample model
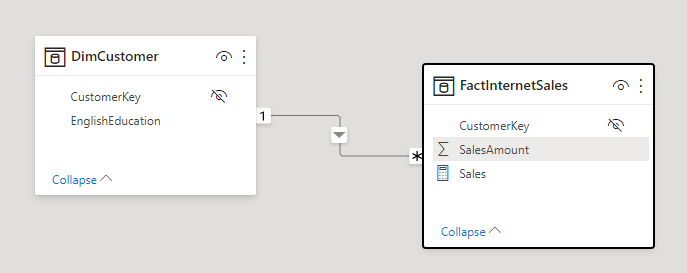
I have a simple dataset with two tables; DimCustomer and FactInternetSales, they are connected to each other based on CustomerKey, which means the DimCustomer can filter the FactInternetSales.
Sum of Sales: Explicit Measure
If I want to show the sum of sales in my report, I can create a measure with a simple calculation below;
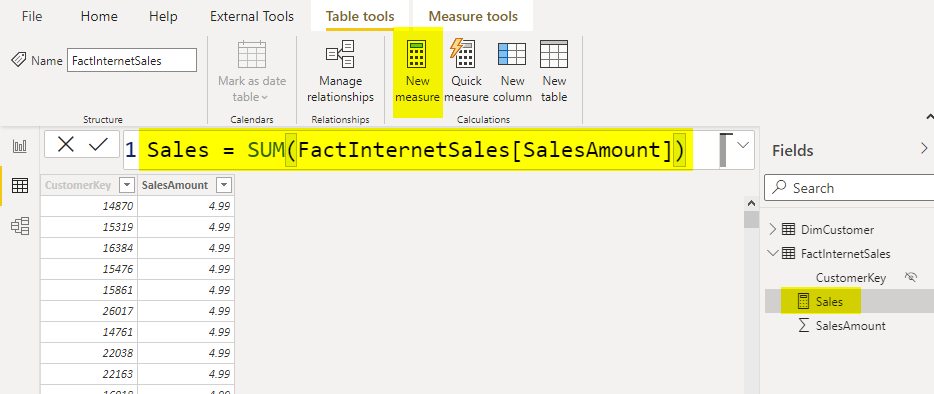
Sales = SUM(FactInternetSales[SalesAmount])
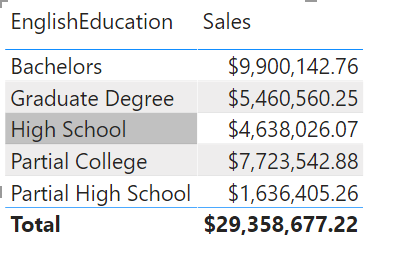
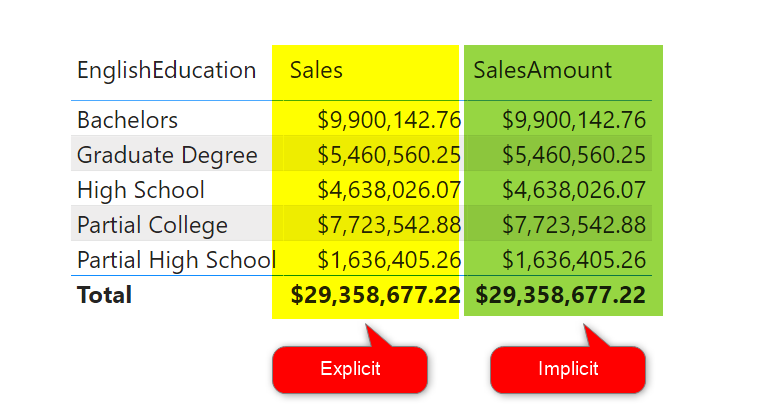
The measure will show the sum of sales aggregated by whatever filtering the FactInternetSales table. In the below, I have the Sales measure filtered by the EnglishEduction field from DimCustomer.
Whenever you create a measure yourself in Power BI, that is called Explicit measure.
Sum of Sales: Implicit Measure
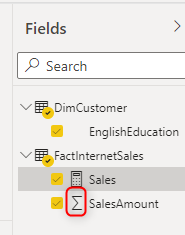
The measure above shows the sales value, however, there is another and more popular way of getting the sales value. That is by dragging and dropping the SalesAmount column (from the FactInternetSales table) directly into the report’s visual.
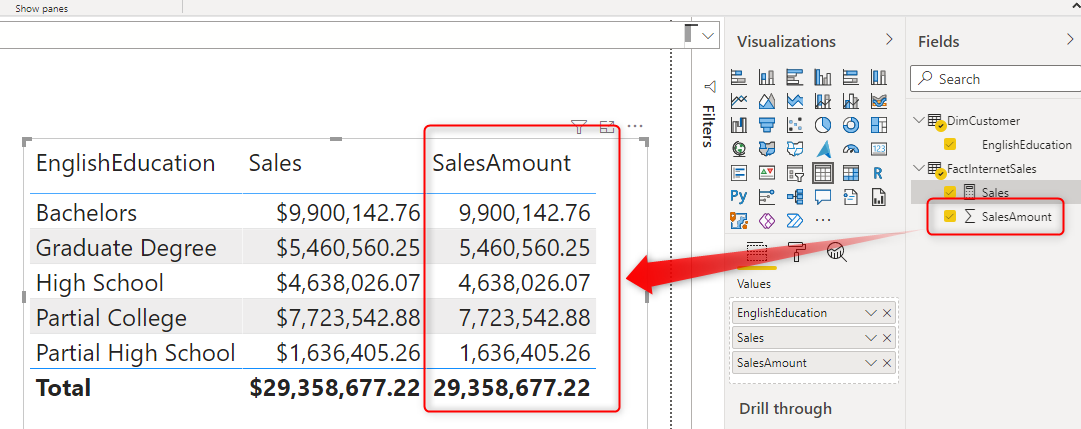
If you notice, you will see a Sigma (or sum) icon beside the SalesAmount column. This is an icon you will see beside every numeric column (not columns participating in relationships) that are by default set in Power BI as auto-summarizable. This means whenever you visualize that column in the Power BI, Power BI shows you the aggregation (the summarization in this case) instead of individual values.
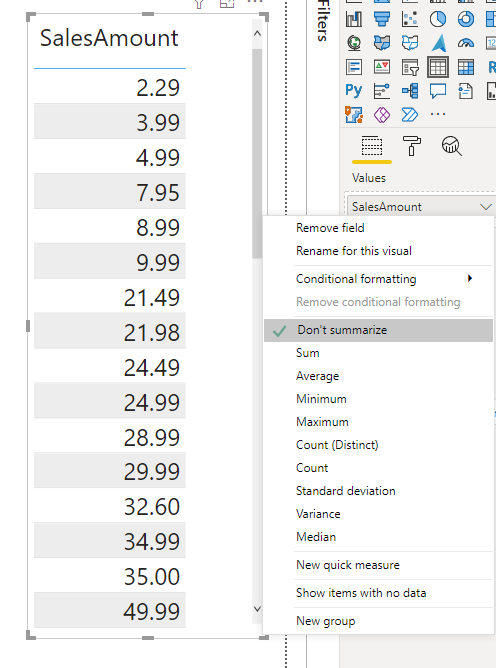
If Power BI didn’t summarize the values of SalesAmount, then we would have seen below: the list of values in the SalesAmount column;
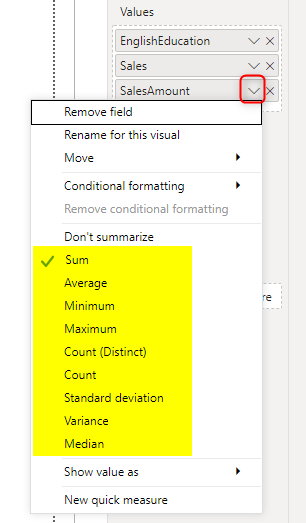
The auto-summarization that Power BI automatically applies on the numeric columns is called an Implicit Measure. An implicit measure is not only in the form of Sum. you can change that in the visual by changing the aggregation;
Or you can change the aggregation at the field level so that it will be used with that default aggregation in all visuals, For example, for something like Rating, you might use Average.
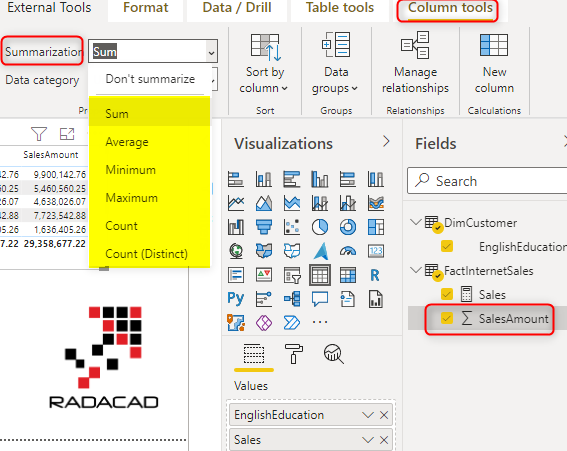
Still, the above measures are called Implicit measures.
Quick measures are also Explicit measures
Although, you don’t really write the DAX expression when you create a quick measure, however, it is still considered as an explicit measure.
The difference between Explicit and Implicit measures
So, in fact, there are two ways to achieve the sum of sales; using an implicit measure created by Power BI automatically, or writing an explicit measure. What is their difference then? let’s explore.
Performance
I get this guess at first whenever I explain about the explicit and implicit measures; “Are they different in their performance?” The answer is No. Because Power BI is just creating a calculation very similar to what you might have had written. For the SalesAmount, it would be Sum(SalesAmount) when Power BI creates that automatic summarization. So it is not different at all in the performance.
Flexibility
Writing an explicit measure will give you more flexibility of course. You can use DAX functions such as Calculate, filter functions, or whatever you want. Using the implicit measures, you are limited to the aggregation listed in the Power BI Desktop.

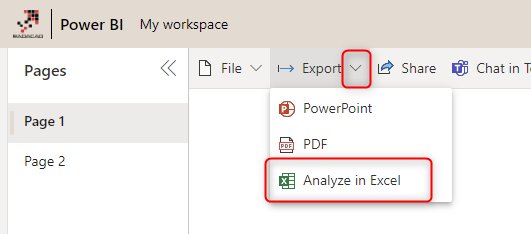
Analyze in Excel
The main difference between explicit and implicit is when you use the measure in Excel. Power BI enables you to connect to the model published in the Power BI Service using Excel. This feature is called Analyze in Excel and I explained it here. Analyze in Excel is a much better way to connect to the data model and extract information than exporting data because Analyze in Excel has a live connection to the Power BI dataset. I explained about it here:
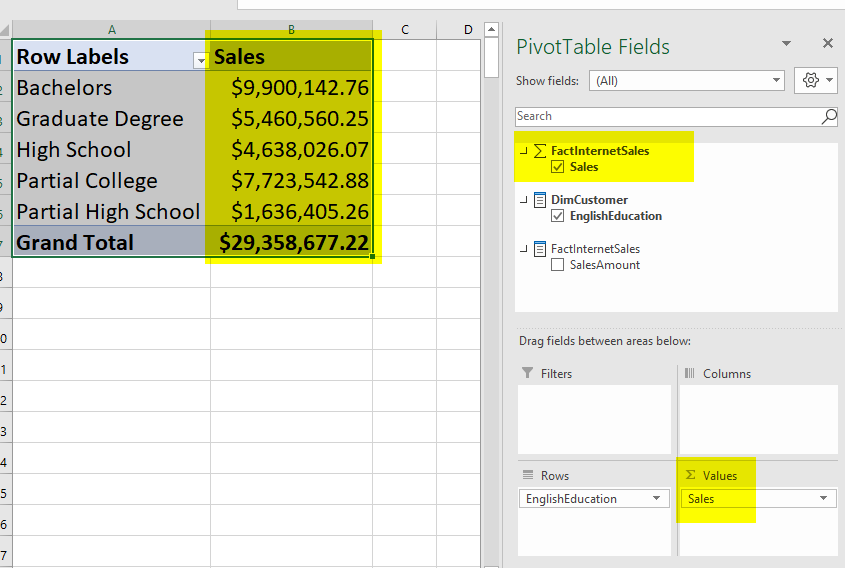
I can connect to a Power BI dataset using Analyze in Excel from the Power BI service.
I cannot use any implicit measures in the values section of my pivot table or pivot chart in Excel.
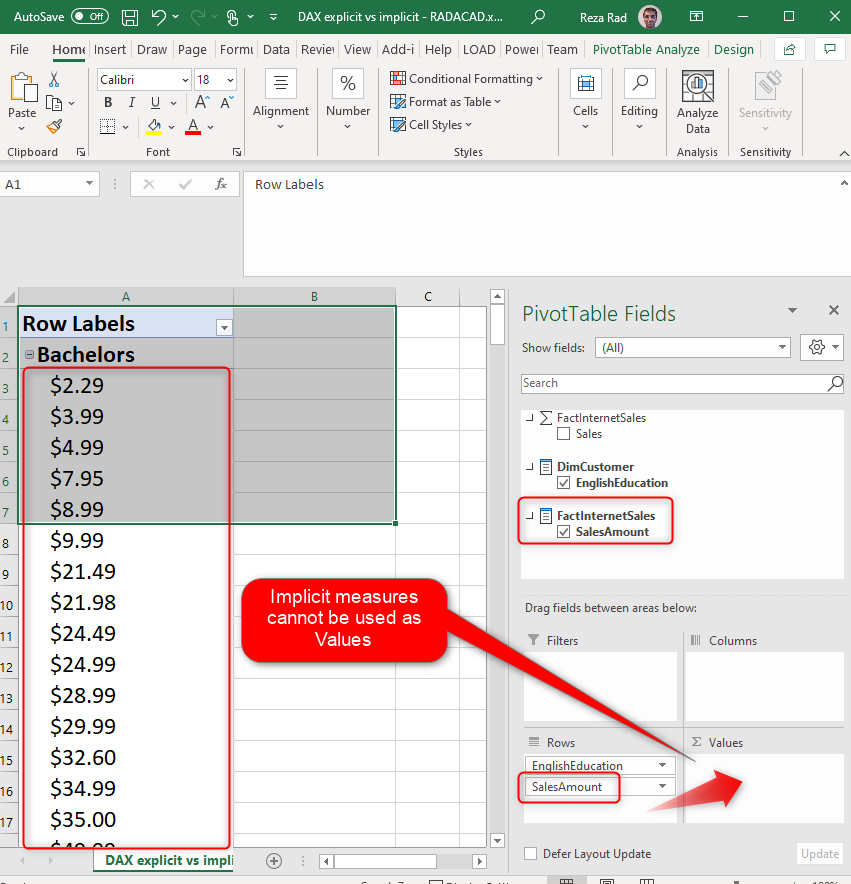
But explicit measures are absolutely fine;
This is a big difference between the two types of measures from Excel’s point of view. Excel doesn’t understand the implicit measure created automatically by Power BI.
If your users are not using Analyze in Excel feature at all, then you can just continue using implicit measures in Power BI whenever you can. However, if your users are Excel users, then the usage of explicit measures will help them in analyzing that data in excel later on.
Consider hiding the column
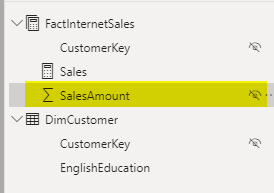
If you are creating simple explicit measures for your numeric columns (Such as Sum(SalesAmount)), then I strongly recommend hiding the actual column, because having both the column and the measure would make users (and sometimes even yourself) confused.
Also; a quick tip is that if you hide all the columns from your table and only measures are visible, your table will show the icon of a measure group. You can see that in the FactInternetSales below.
Summary
There is no performance difference between the implicit and explicit measures. However, you will have better flexibility with explicit measures (because you can write whatever you want in DAX). The main advantage of explicit measures is they can be used as a value in Excel’s pivot table when connected using Analyze in Excel. This is a big advantage because there are many Excel users who will gain the benefit from analyzing the Power BI dataset.


Reza is author of more than 14 books on Microsoft Business Intelligence, most of these books are published under Power BI category. Among these are books such as Power BI DAX Simplified, Pro Power BI Architecture, Power BI from Rookie to Rock Star, Power Query books series, Row-Level Security in Power BI and etc.
He is an International Speaker in Microsoft Ignite, Microsoft Business Applications Summit, Data Insight Summit, PASS Summit, SQL Saturday and SQL user groups. And He is a Microsoft Certified Trainer.
Reza’s passion is to help you find the best data solution, he is Data enthusiast.
His articles on different aspects of technologies, especially on MS BI, can be found on his blog: https://radacad.com/blog.