
TOPN is a function in DAX that gives you the ability to select the top items from a table based on an expression. In this article and video, I’ll explain how to use the TopN function in DAX either to create a calculated table or to use it in a measure to achieve analysis such as; comparison with the average amount of the top group.
Video
TOPN function in DAX
TOPN is a tabular function in DAX, and the table it returns is a subset of the input table but only the top (or bottom) items of that table based on evaluation of an expression. TOPN function can be used like this:
TOPN(<n_value>, <table>, <orderBy_expression>, [<order>[, <orderBy_expression>, [<order>]]…])
- n_value: The count of items you want to pick either from the top or bottom of the input table.
- table: the input table to get the subset of items from it
- orderBy_expression: The expression used to order the items of the table so that the top or bottom items be picked.
- order (optional): The selection should be from top or bottom of the table? default is DESC which means TOP, if it changes to ASC it would act like bottom.
As you can understand from the above, the TOPN function is not just used to get the top items, but also the bottom items (based on the order parameter).
Some samples of TOPN
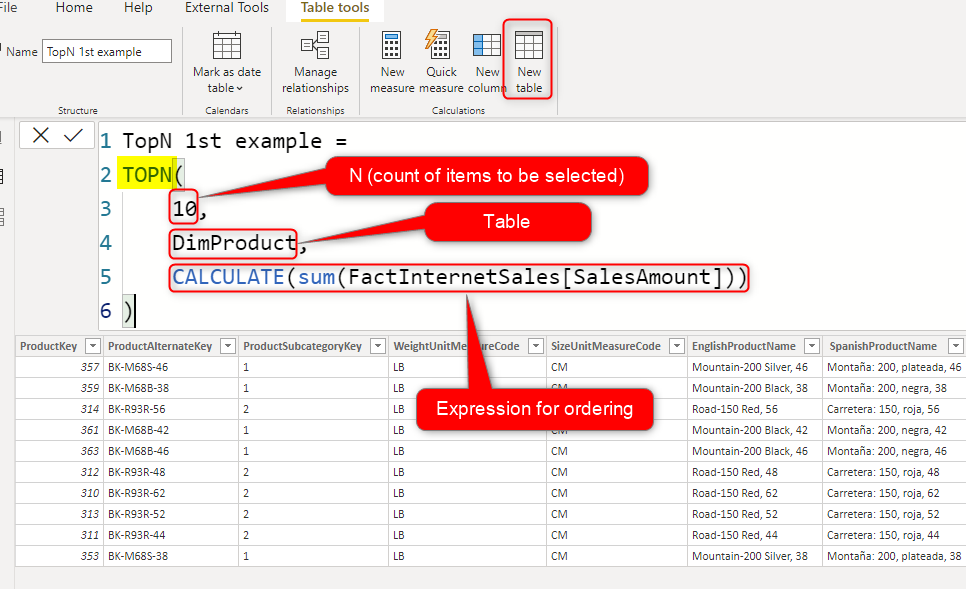
TOPN can be used as simple as below to give us the top 10 products based on the sales.
TopN 1st example =
TOPN(
    10,
    DimProduct,
    CALCULATE(sum(FactInternetSales[SalesAmount]))
)
The input table of the TOPN function can be any function that returns a table as well. for example, the expression below is the top two product colors based on the sales;
TopN 2nd example =
TOPN(
    2,
    VALUES(DimProduct[Color]),
    CALCULATE(SUM(FactInternetSales[SalesAmount]))
)
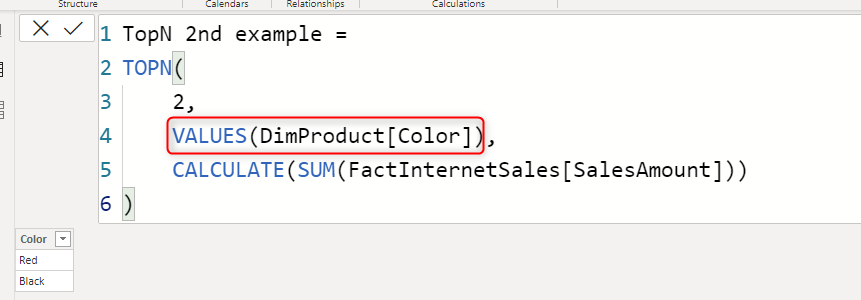
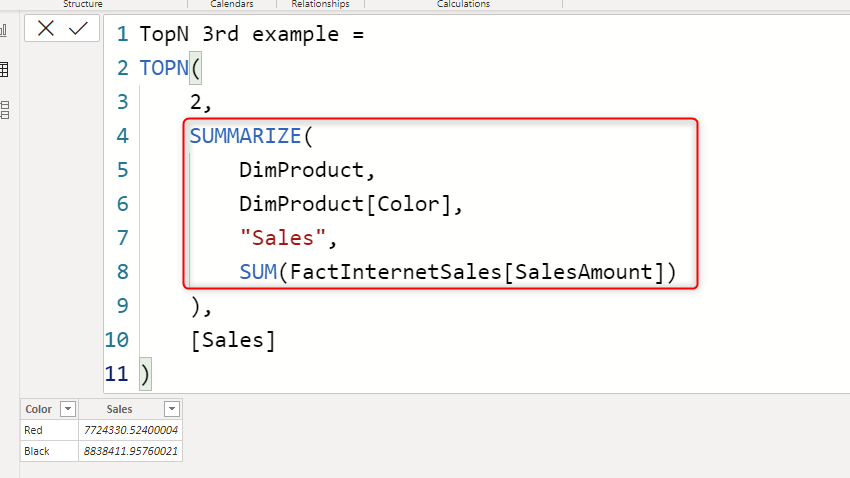
The example above doesn’t show the sales amount, so there isn’t an easy way to test it. We can use a function such as Summarize to build a virtual table with the Sales amount in it, and then get the top items from it. To learn more about Summarize read my article here.
TopN 3rd example =
TOPN(
    2,
    SUMMARIZE(
        DimProduct,
        DimProduct[Color],
        'Sales',
        SUM(FactInternetSales[SalesAmount])
    ),
    [Sales]
)
The whole Summarize section used as the input table to TOPN function.
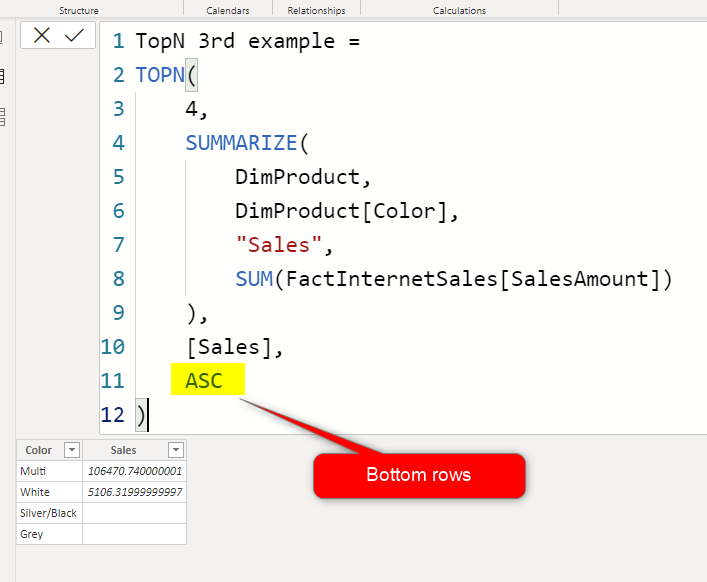
Bottom N
There are no function names as BottomN, but you can simply change the order in the TOPN to ASC, and then you will get BottomN, as below;
When N is more than N!
TOPN usually should return a table with only N rows. However, in case of ties, it bring all ties. This means TopN of 10 might have more than 10 rows if there are two items with the same expression results in the top 10 list. Here is an example;
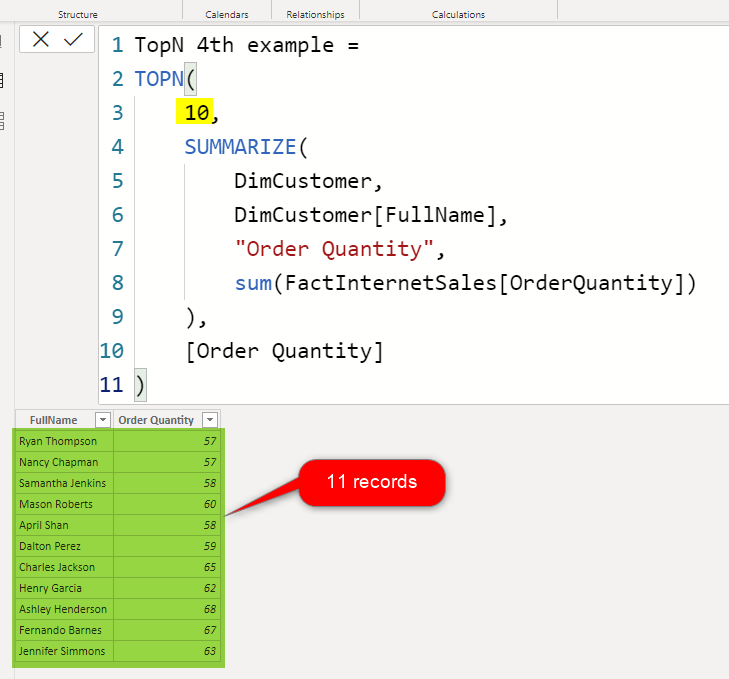
To avoid this, you can change the expression in a way to avoid the tie. Or if you want all the ties, then the result is what you expect anyway.
Using TOPN in Measures
TOPN can be used to create a calculated table, as you have seen in the example above. However, similar to many other tabular functions, the most powerful way of using it, is when used in a measure. Using TOPN inside a measure will give you the ability to have to top (or bottom) list dynamically, based on selection criteria in the report.
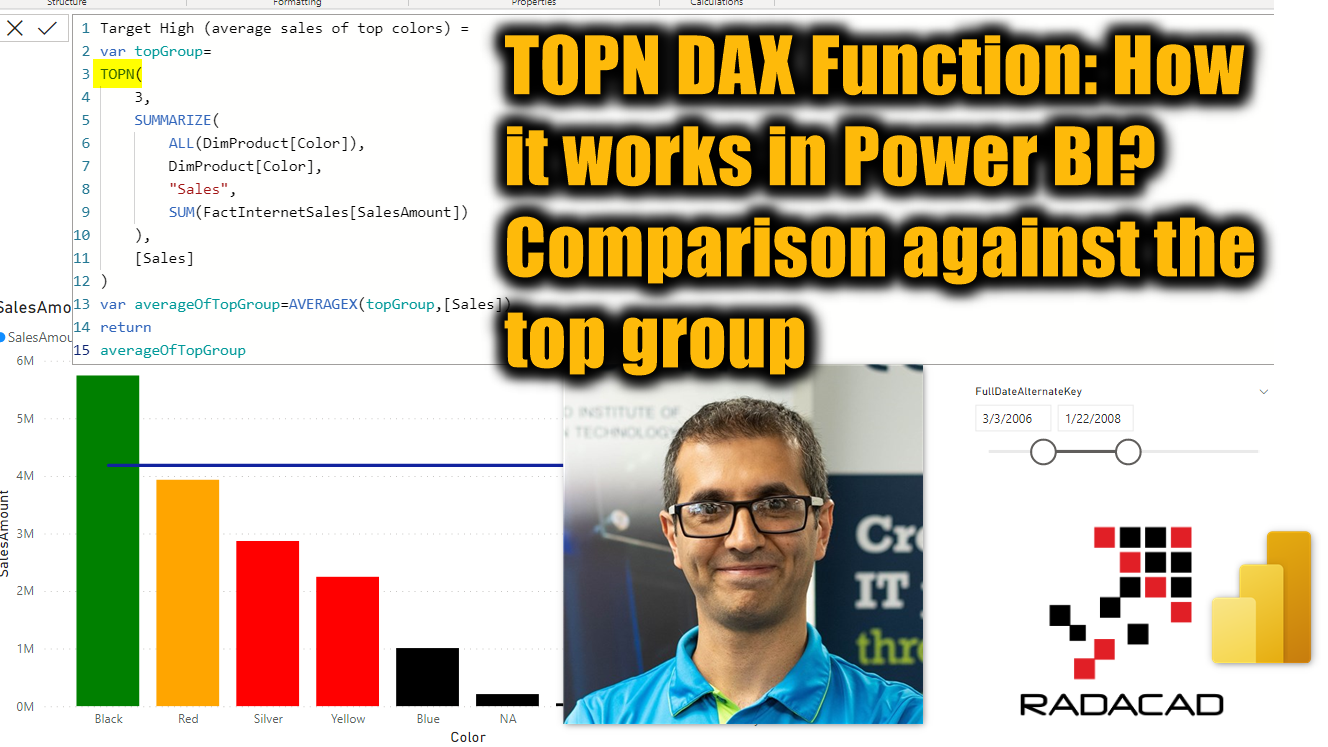
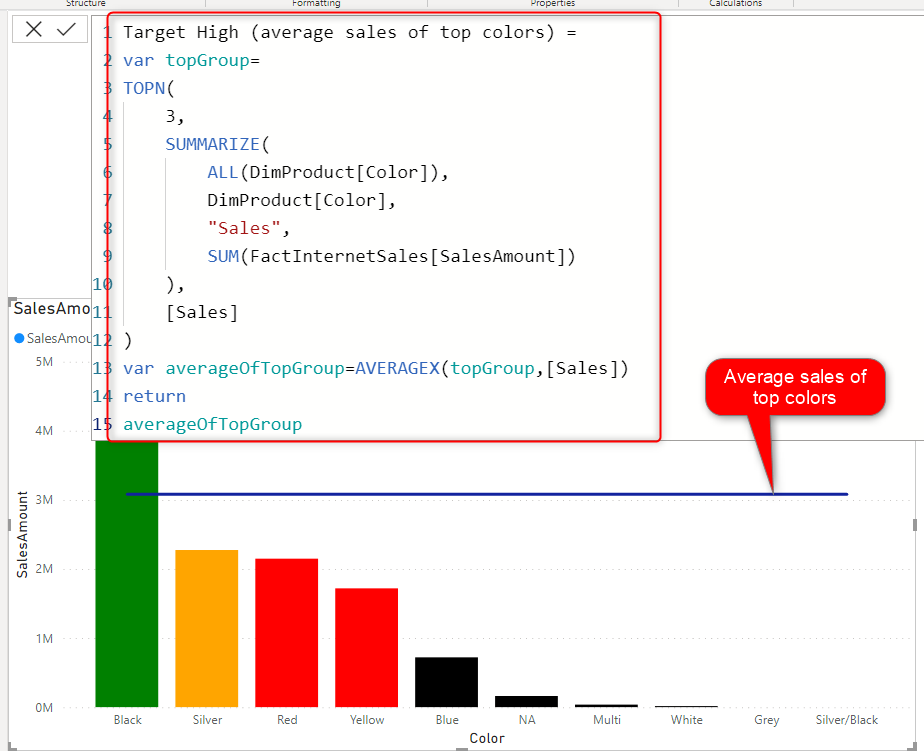
Average Sales of the top items
As an example, let’s say we want to calculate the average sales of the top colors as a target. Our calculation, can use TOPN to create a table with the top 3 items in it as below:
var topGroup=
TOPN(
    3,
    SUMMARIZE(
        ALL(DimProduct[Color]),
        DimProduct[Color],
        'Sales',
        SUM(FactInternetSales[SalesAmount])
    ),
    [Sales]
)
Then we can calculate the average from the outcome of that as below;
var averageOfTopGroup=AVERAGEX(topGroup,[Sales])
This average then can be used in a visual as a target. Here is the whole expression:
This can be even used further to do conditional formatting with the help of DAX with the measure below;
Back Color based on top group =
var topGroupValue=[Target High (average sales of top colors)]
var selectedColorSale=SUM(FactInternetSales[SalesAmount])
var SalesVsTarget=DIVIDE(selectedColorSale,topGroupValue)
return
SWITCH(
    TRUE(),
    SalesVsTarget>=1,'Green',
    SalesVsTarget>=0.7,'Orange',
    SalesVsTarget>=0.45,'Red',
    'Black'
)
And the result is a table visual that both the target and the conditional formatting calculated dynamically based on the average of the top 3 colors.

Summary
TOPN is a very useful function when a calculation required to be done based on top or bottom items in a list based on an expression. TOPN is a tabular function, but if used in a measure, it gives a dynamic calculation possibility which is helpful to create reports like above. TOPN can be used with the ascending order to get the bottom rows as well. and TOPN will bring all ties if they fit in the top items.
Download Sample Power BI File
Download the sample Power BI report here:


Reza is author of more than 14 books on Microsoft Business Intelligence, most of these books are published under Power BI category. Among these are books such as Power BI DAX Simplified, Pro Power BI Architecture, Power BI from Rookie to Rock Star, Power Query books series, Row-Level Security in Power BI and etc.
He is an International Speaker in Microsoft Ignite, Microsoft Business Applications Summit, Data Insight Summit, PASS Summit, SQL Saturday and SQL user groups. And He is a Microsoft Certified Trainer.
Reza’s passion is to help you find the best data solution, he is Data enthusiast.
His articles on different aspects of technologies, especially on MS BI, can be found on his blog: https://radacad.com/blog.
When n=1, and using order (as/desc) is it faster to use topn or sample function? I do know that when n > 1, sample is non deterministic
Hi Raj
The main point is that Sample and TOPN if used with 1, won’t exactly behave the same. sample gives you a sample row. but TOPN gives you the top or the bottom row
Cheers
Reza
Best set of examples and descriptions for use of the TOPN function I’ve found, thanks!
I am glad you liked it