
Microsoft Fabric offers a workload for real-time solutions. Real-time Analytics can be used for streaming data, such as the data coming from IoT devices. It can be used not only to ingest the data but also to analyze it and use it for other Fabric workloads, such as data science. In this article and video, you will learn what is Real-Time Analytics in Microsoft Fabric and how it works.
Video
Microsoft Fabric
Microsoft Fabric is an end-to-end Data Analytics software-as-a-service offering from Microsoft. Microsoft Fabric combined some products and services to cover an end-to-end and easy-to-use platform for data analytics. Here are the components (also called workloads) of Microsoft Fabric.

To learn more about Microsoft Fabric and enable it in your organization, I recommend reading the articles below;
Real-Time Analytics
The data analytics solution is not always on a small scale data that gets updated once a day. There are other shapes of data. One shape of data is big data, with entries updating every second, even milliseconds. When you work with systems where data entries happen often, you will get this kind of data. Stock exchange, highly transactional system, IoT devices capture and send data often. With these source systems, the old mechanism of doing ETL of that data into a data warehouse and running the ETL every day or even every hour might not work. That is why, through time, streaming systems are created.
A data streaming system is a system that collects the changes as they happen in the source system through mechanisms such as event processing and APIs. Then, the data will be processed in a specific database system, which supports querying the data as they come. Different vendors have different technologies that support data streaming. Microsoft Fabric has Real-Time Analytics for data streaming.
The Real-Time Analytics is a platform where streaming and time-series data can be processed. It has its database technology called KQL databases, with its query language called KQL, and it has components such as Event Stream, which can expedite the process of feeding data into that database and other destinations from sources such as event hub or IoT hub.
The types of systems that real-time analytics can be helpful at are included but not limited to;
- Predictive maintenance
- Environmental monitoring
- Quality control
- Tracking and management
- Cyber security
- Energy management
- Health
- …
Sample Scenario
Streaming data are often associated with IoT devices. Imagine there are temperature sensors in each room of the hotel, and each sensor sends the temperature of that room every second to a centralized database. Then, the captured data can be analyzed and visualized in a real-time dashboard and sent simultaneously to a machine learning process for finding the patterns in the data and performing an action based on that (like increasing or decreasing the temperature using other devices). The KQL database will be the central place where the data gets collected. Event Stream will get data from the sources (IoT hubs) and send it to the KQL database, some machine learning processes, and Notebook execution. And Data Activator for performing further actions. KQL Queryset can be used in Power BI to query the real-time data from the KQL database for a real-time dashboard.
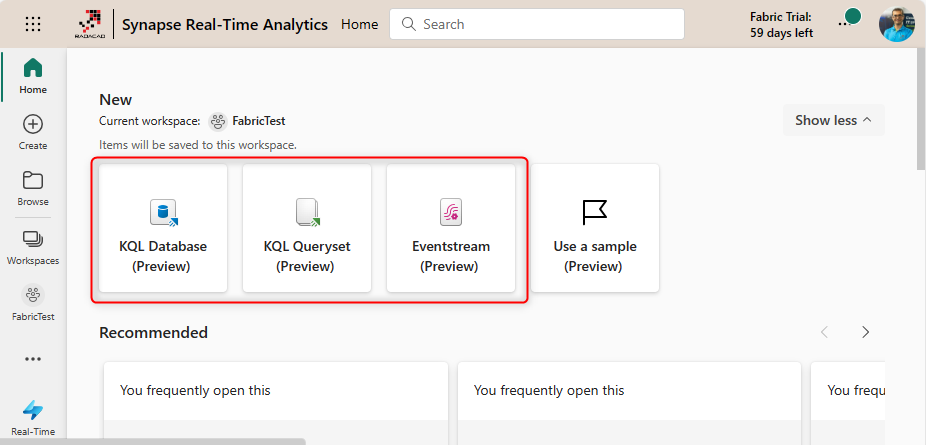
Components of Real-Time Analytics in Fabric
There are three main components for a Real-Time Analytics system in Fabric;
- Eventstream: is a hub of streaming data, where multiple sources (including Event Hub) and various destinations (including KQL database) can be set.
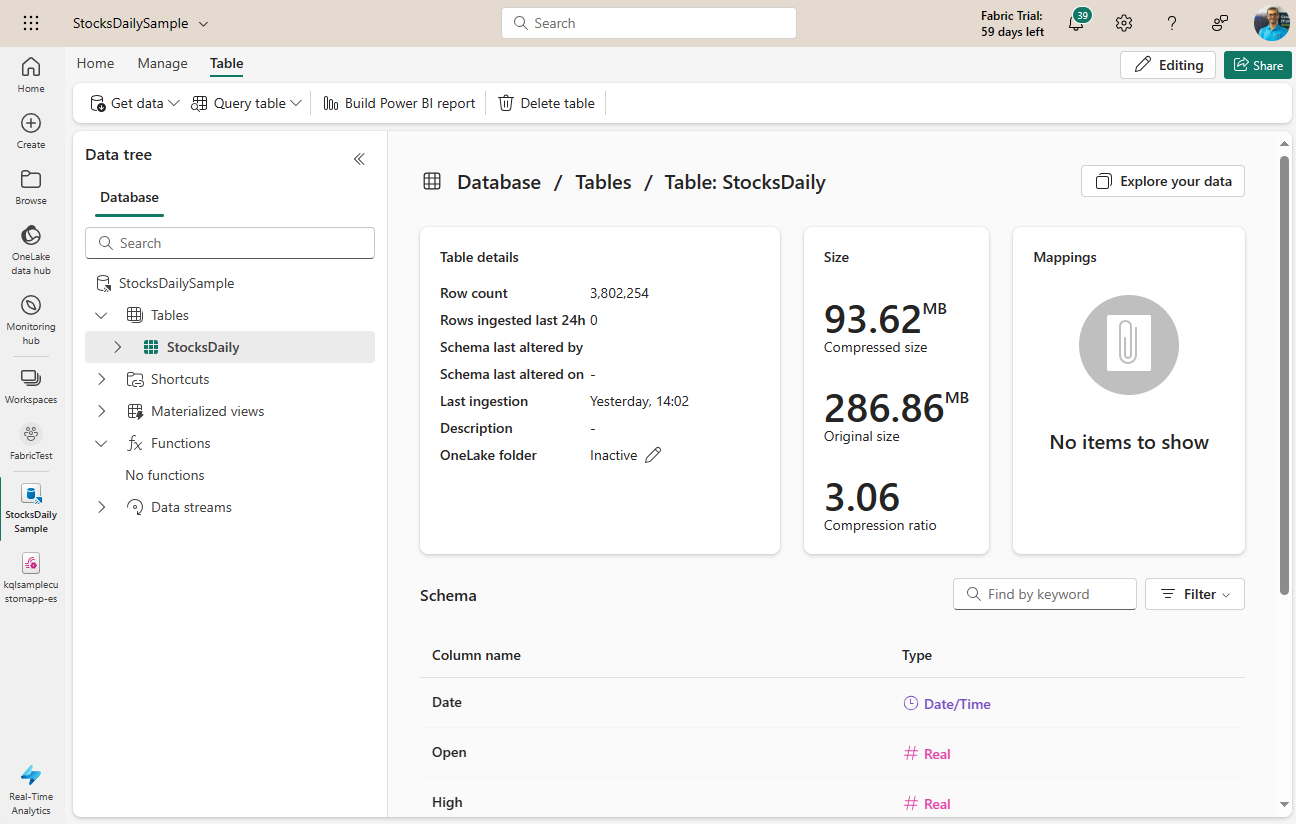
- KQL Database: is the database that uses OneLake as the underlying storage system.
- KQL Queryset: for saving, managing, exporting, and sharing KQL queries.
Eventstream
You can have multiple sources and multiple destinations in one Eventstream. The Eventstream will fetch data from the sources and pass it on to the destinations.
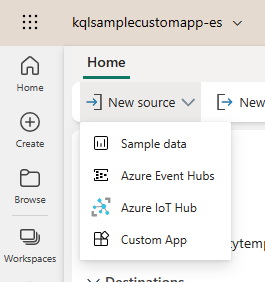
Eventstream supports the sources below;
- Azure Event Hub
- Azure IoT Hub
- Custom App
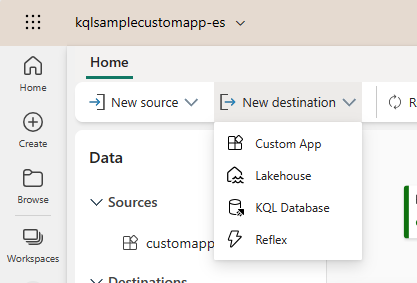
Destinations can be the following;
- Lakehouse
- KQL Database
- Reflex (Data Activator)
- Custom App
For example, the input data from the IoT hub can be sent to the KQL database and Reflex simultaneously.
Eventstream also has components for logging and monitoring the incoming and outgoing data.
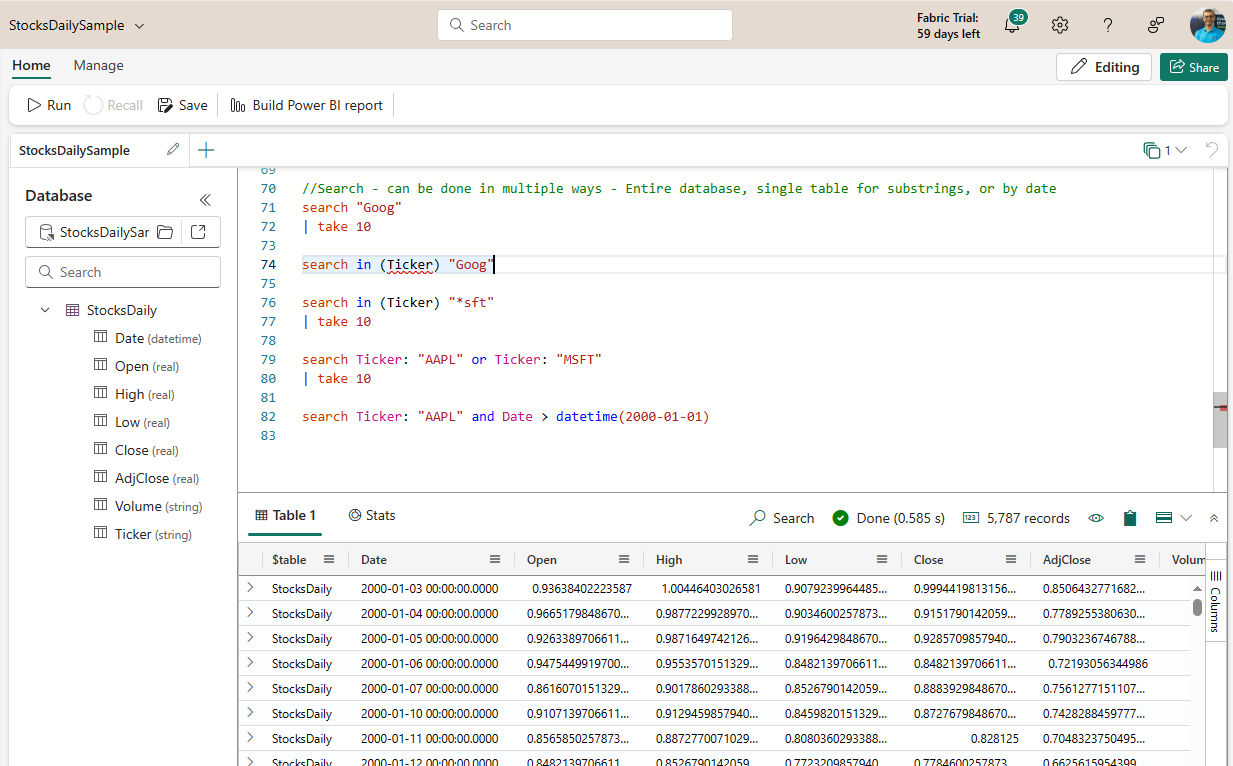
KQL
KQL stands for Kusto Query Language. KQL is a language for data exploration and statistical modeling. It also works with tables and columns structure. The query structure differs from something like SQL; however, it is not a complicated language to learn.
For example, a query from a table TempTbl and HumidityTbl with some conditions can be like the below;
TempTbl
| where Temp > 50
| join (HumiditiyTbl) on Device
| project Temp, Humidity, DateTime
KQL Database
KQL Database is a place where you can store data as tables. This database structure can also use Shortcuts, functions, and materialized views.
KQL Queryset
KQL Queryset is like the management studio for KQL queries and codes. You can have multiple tabs with KQL code, run the queries, save the results, export them, and share them with others. It is like SSMS for SQL queries.
Getting Started Example
Nothing makes it more understandable than a sample demo. Here is the scenario I am building;
- Data entries are coming through a custom application. (assume that this is part of an IoT device.)
- The data entries are sent to a KQL database.
- The data in the database is then visualized in a real-time Power BI report that can be used for monitoring the changes.
The above scenario is straightforward. However, it will cover an end-to-end usage of the Real-Time Analytics.
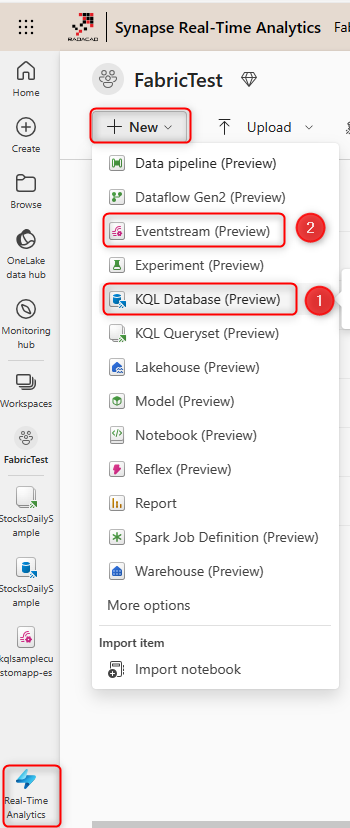
Step 1: Create a KQL database and an Eventstream
Start the example by creating a KQL database. I named it as KQLSampleCustomApp.
Then, create an Eventstream. I named it as KQLSampleCustomApp-es.
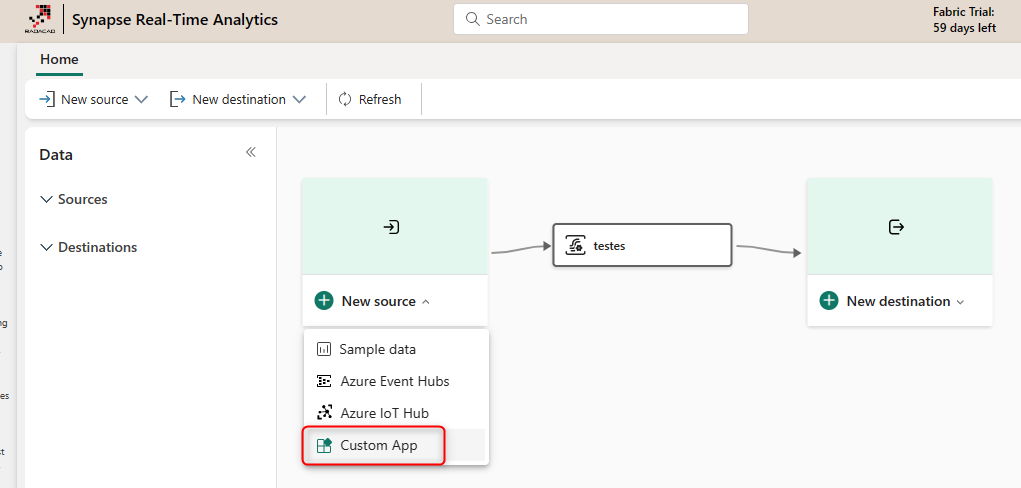
Step 2: Set up the source for the custom application
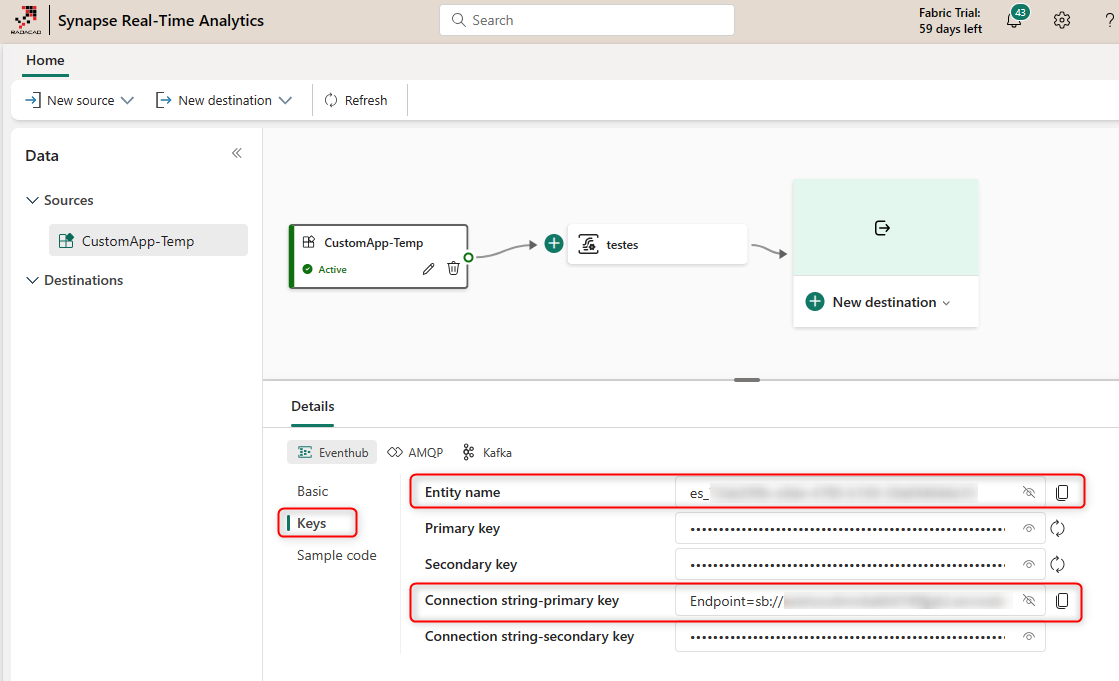
An Eventstream can have multiple sources and destinations. Click on the Eventstream, and then Add a Source as Custom App. I named mine as CustomApp-Temp.
Once the custom app is added, you should have its details, including the Keys. The Keys are essential for the custom application to send the data to the Eventstream. The two most important ones here are the Connection string-primary key and the Entity name.
Step 3: Send data using the custom application
The custom application can be created using different editors and written in other languages. We use Javascript as the language and Visual Studio Code as the Editor for simplicity. This means you will need Node.Js and the Visual Studio Code also installed.
Here is the code for the application;
const { EventHubProducerClient } = require("@azure/event-hubs");
var moment = require('moment');
const connectionString = "";
const entityName = "";
//Generate event data
function getRowData(id) {
const time = moment().toISOString();
const deviceID = id + 100;
const humidity = Math.round(Math.random()*(65-35) + 35);
const temperature = Math.round(Math.random()*(37-20) + 20);
return {"entryTime":time, "messageId":id, "temperature":temperature, "humidity":humidity, "deviceID":deviceID};
}
function sleep(ms) {
return new Promise(resolve => setTimeout(resolve, ms));
}
async function main() {
// Create a producer client to send messages to the eventstream.
const producer = new EventHubProducerClient(connectionString, entityName);
// There are 10 devices. They're sending events nearly every second. So, there are 10 events in one batch.
// The event counts per batch. For this case, it's the sensor device count.
const batchSize = 10;
// The event batch count. If you want to send events indefinitely, you can increase this number to any desired value.
const batchCount = 50;
// Generating and sending events...
for (let j = 0; j < batchCount; ++j) {
const eventDataBatch = await producer.createBatch();
for (let k = 0; k < batchSize; ++k) {
eventDataBatch.tryAdd({ body: getRowData(k) });
}
// Send the batch to the eventstream.
await producer.sendBatch(eventDataBatch);
console.log(moment().format('YYYY/MM/DD HH:mm:ss'), `[Send events to Fabric Eventstream]: batch#${j} (${batchSize} events) has been sent to eventstream`);
// sleep for 1 second.
await sleep(1000);
}
// Close the producer client.
await producer.close();
console.log(moment().format('YYYY/MM/DD HH:mm:ss'), `[Send events to Fabric Eventstream]: All ${batchCount} batches have been sent to eventstream`);
}
main().catch((err) => {
console.log("Error occurred: ", err);
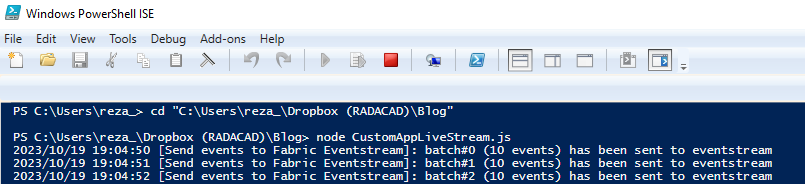
});The code above can be saved as a file with a name such as CustomAppLiveStream.js. You must paste your connection string primary key and the entity name in the code. First, you must install the required packages to run the code in PowerShell.
npm install @azure/event-hubs
npm install moment
Once done, you can execute the code using the below lines in PowerShell;
C:\EventStreamFolder>node CustomAppLiveStream.jsOnce executed, you should see messages like the one below showing that data is getting sent to the Eventstream.
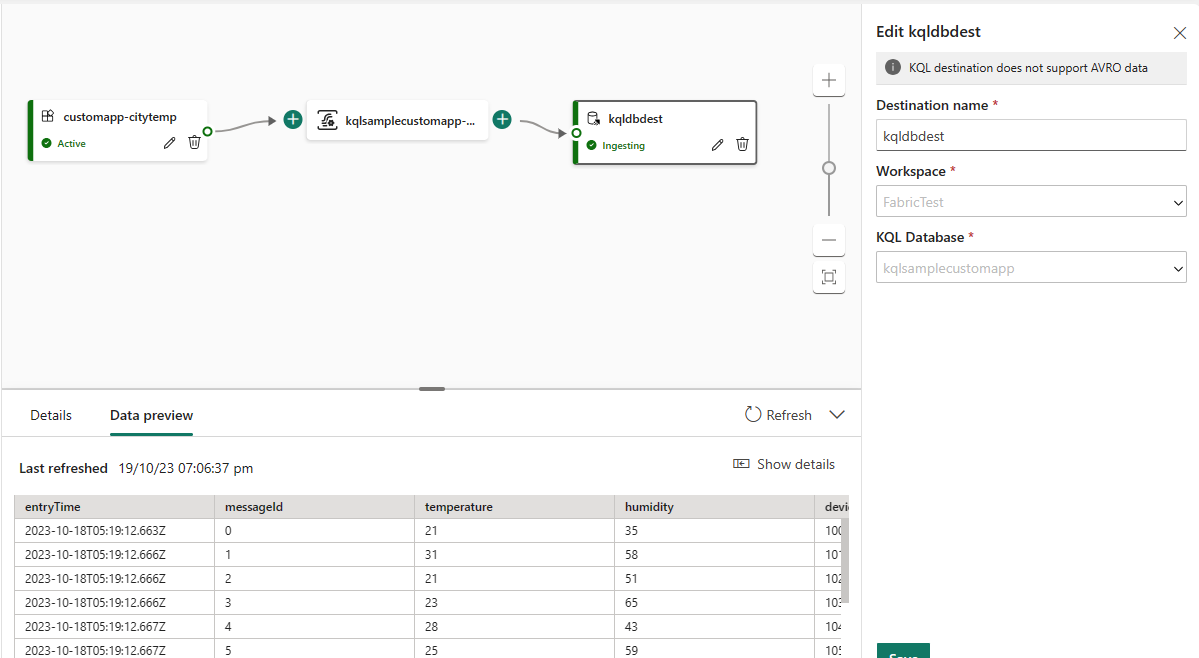
Step 4: Set Destination for KQL Database
In the Eventstream, you can set up a destination for the KQL Database we have created before. There will be steps in which you map the incoming data structure to the destination data structure in the KQL database; follow the steps and get them mapped.
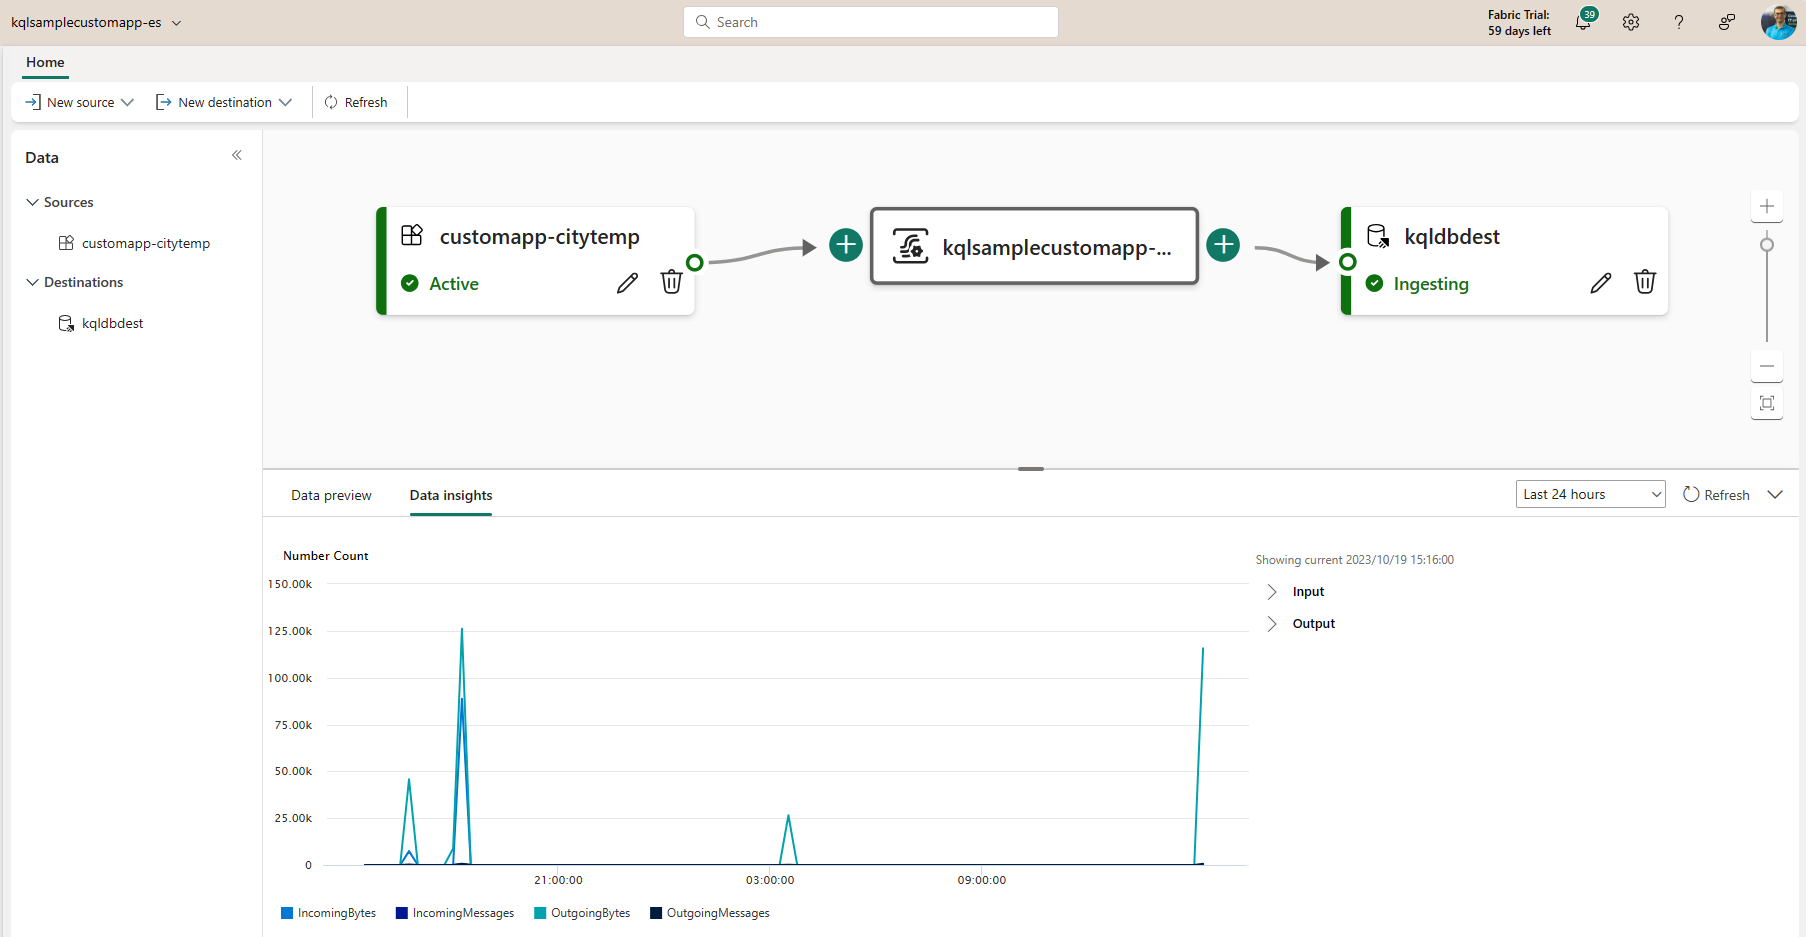
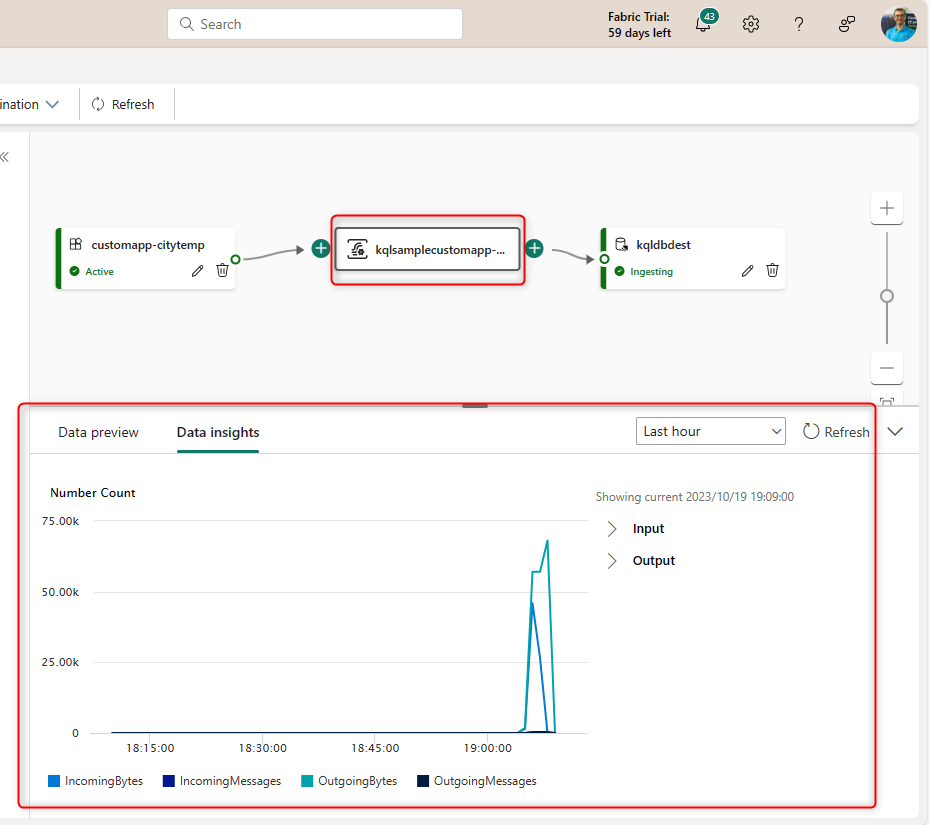
Step 5: Monitor the Eventstream
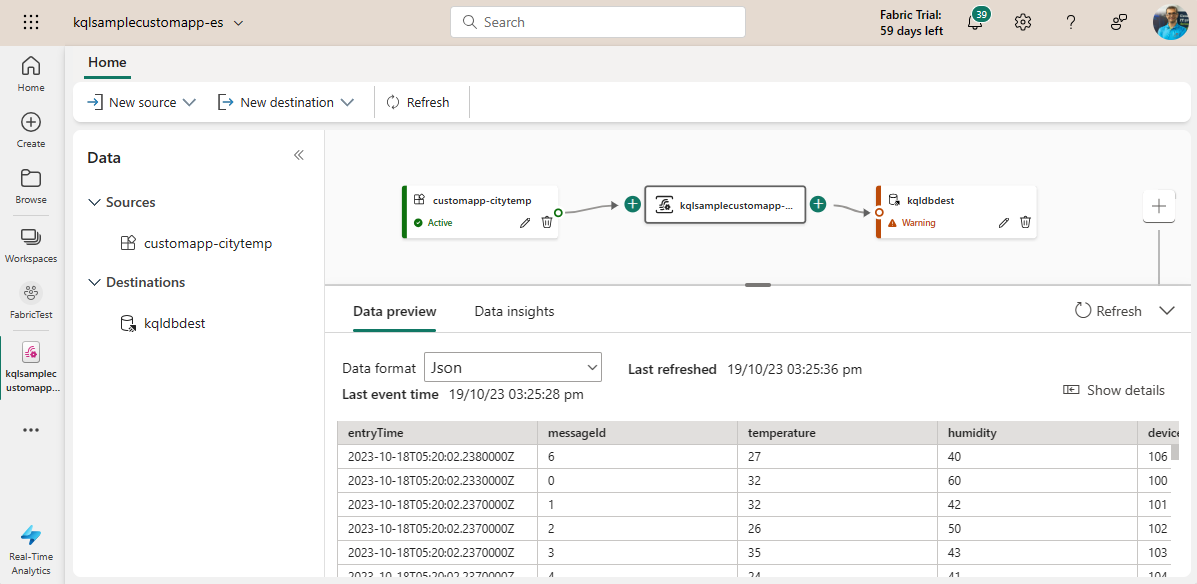
You can monitor the data input and output in the Eventstream using the Data Insights tab and the Data Preview tabs.
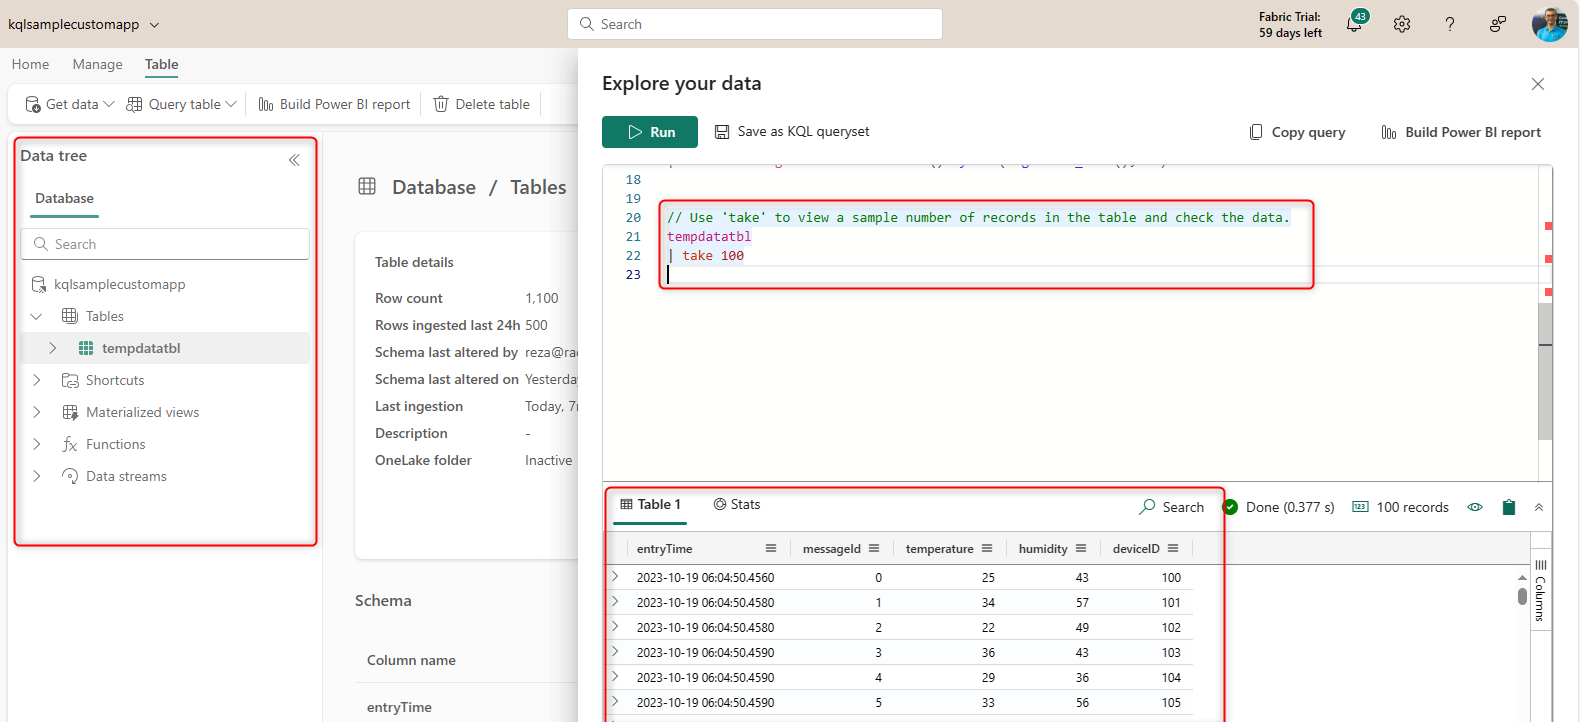
Step 6: Query the data in the KQL database
Once the data is loaded into the KQL database (you may need to re-run the custom app once again after you set up the destination in the Eventstream), you can query the data using the Query Table > Show any 100 rows.
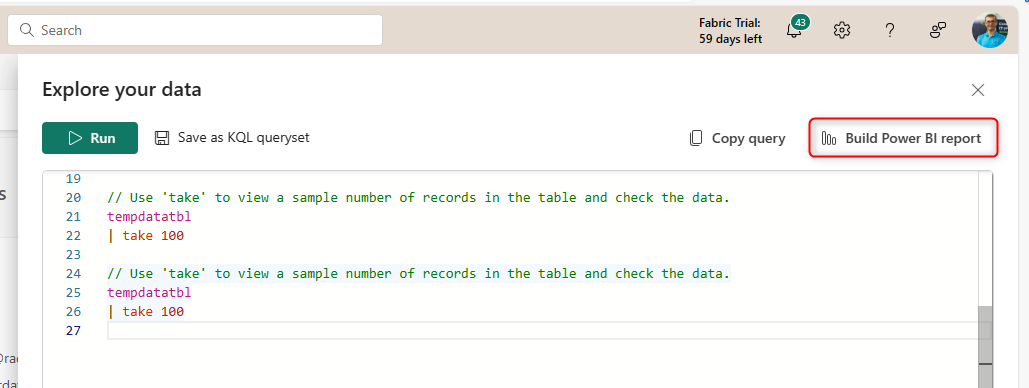
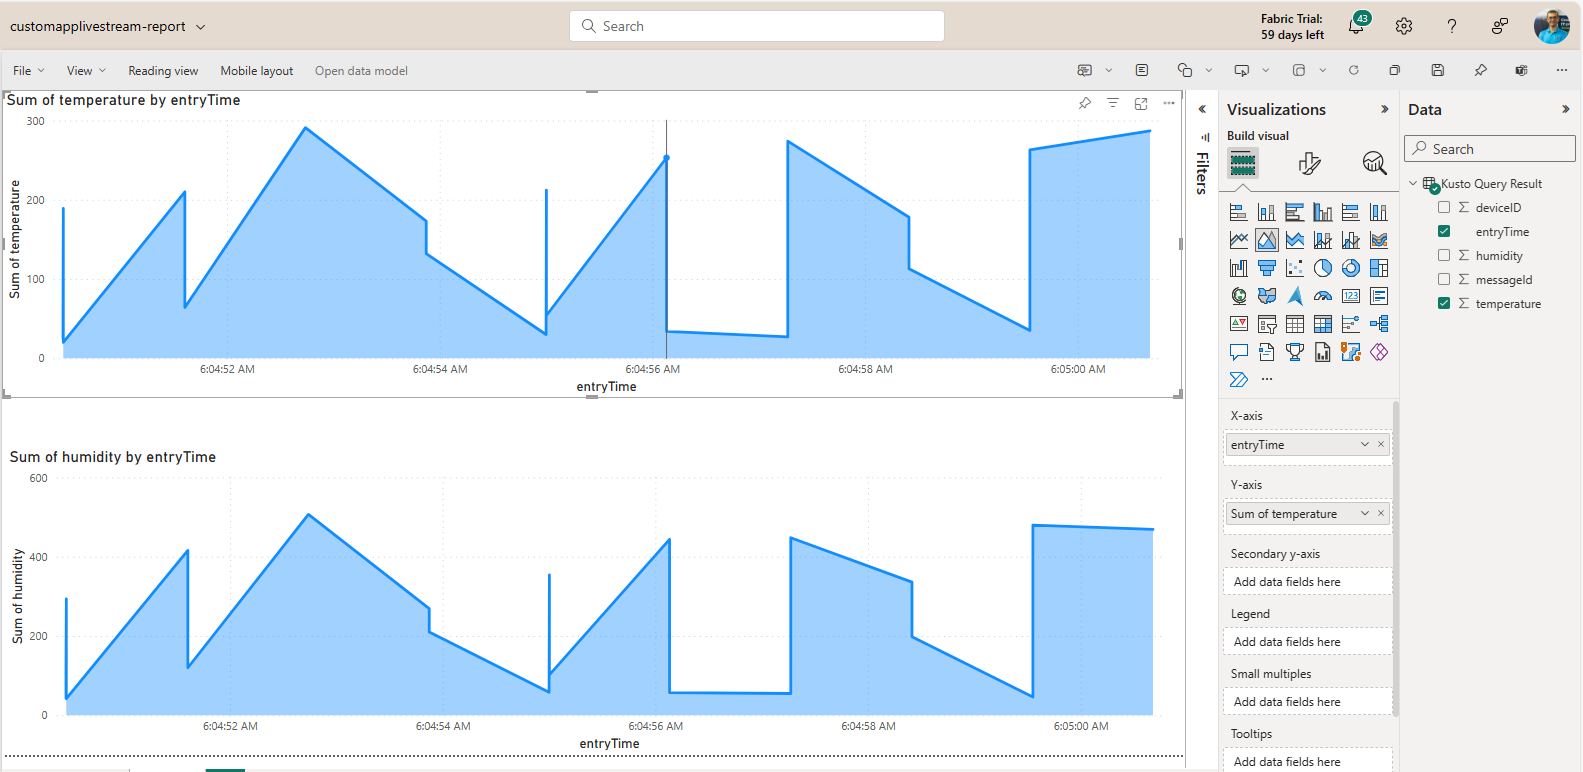
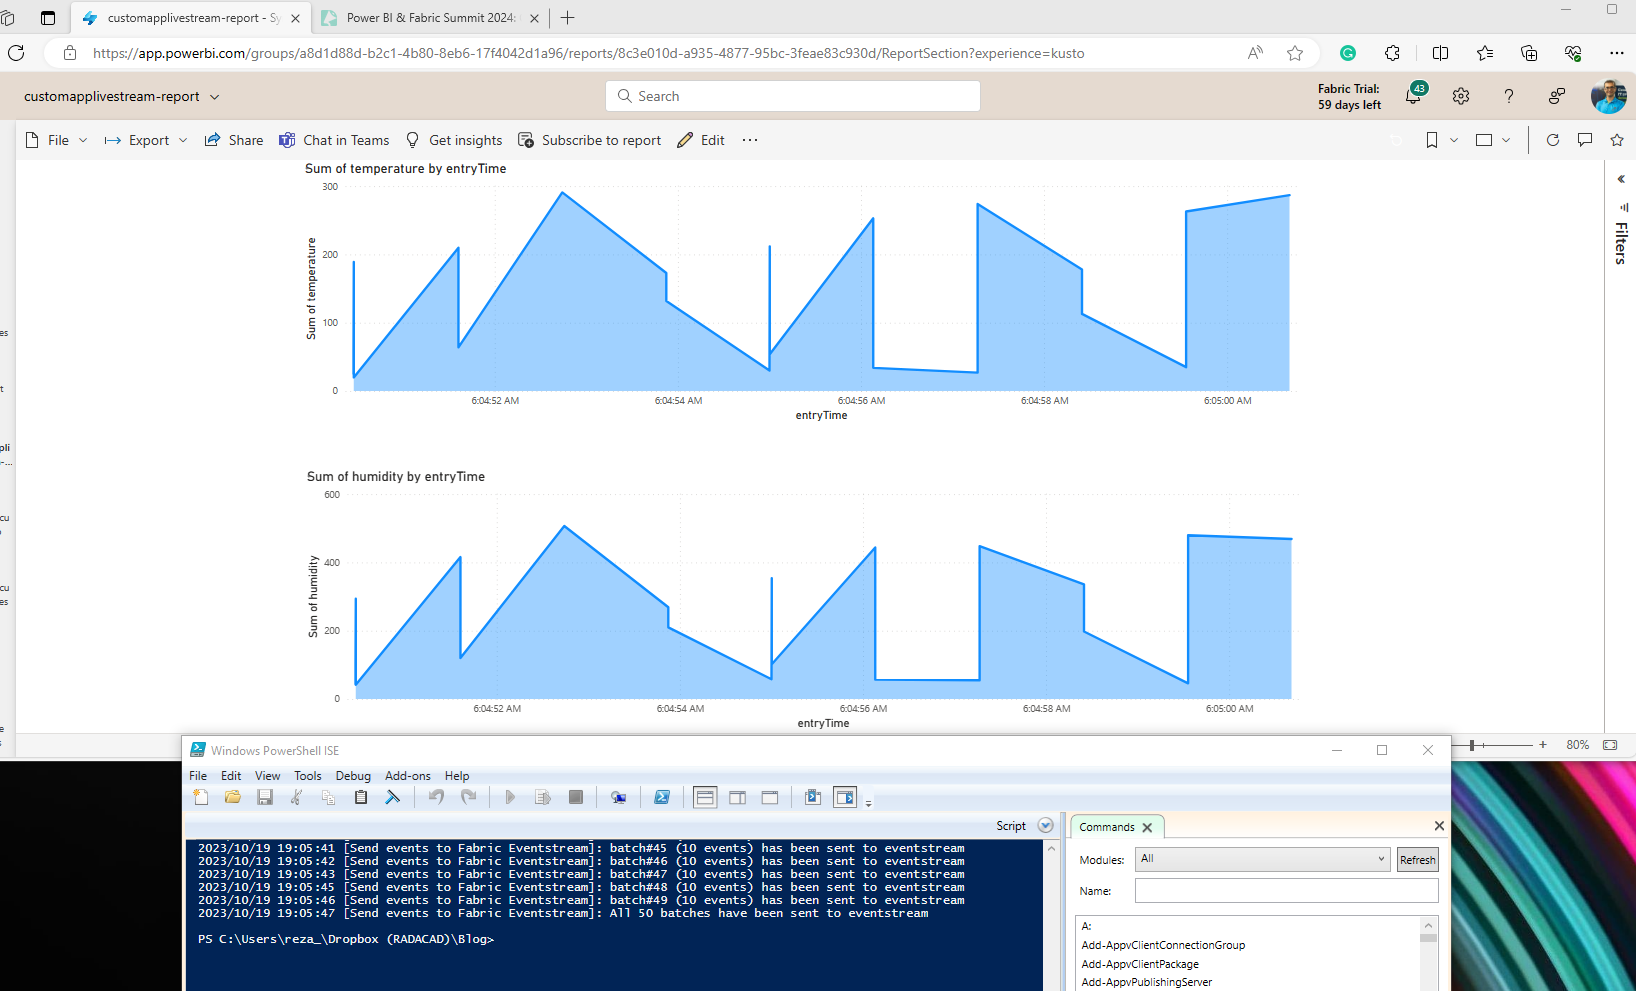
Step 7: Real-time report using Power BI
You can build a Power BI report directly on the KQL database table using the option provided.
This is a simple report with two area charts;
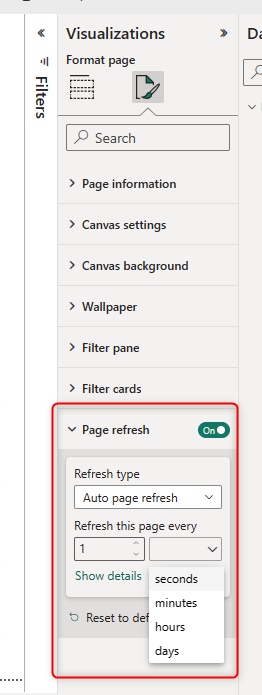
The critical part of the report is to set the page refresh to the period you want. I set it to every 1 second. (the capacity admin in the Admin Portal can set the minimum value of this.)
Step 8: The outcome
You can now execute the custom app again and check the report simultaneously to monitor the changes in the real-time report.
Summary
In this article, I explained Real-Time Analytics in Microsoft Fabric. Real-time analytics provides the platform and tools for capturing the streaming and time series data and storing it in a KQL database, which then can be queried using KQL, and Power BI can have real-time reports connected to it. Eventstrem enables the system to have multiple destinations, which can be very helpful in scenarios where you want to monitor analytics and action simultaneously. You have seen a quick example of a real-time application and monitoring that data using this service.


Reza is author of more than 14 books on Microsoft Business Intelligence, most of these books are published under Power BI category. Among these are books such as Power BI DAX Simplified, Pro Power BI Architecture, Power BI from Rookie to Rock Star, Power Query books series, Row-Level Security in Power BI and etc.
He is an International Speaker in Microsoft Ignite, Microsoft Business Applications Summit, Data Insight Summit, PASS Summit, SQL Saturday and SQL user groups. And He is a Microsoft Certified Trainer.
Reza’s passion is to help you find the best data solution, he is Data enthusiast.
His articles on different aspects of technologies, especially on MS BI, can be found on his blog: https://radacad.com/blog.