

I have written two articles about fuzzy operations in Power BI and Power Query so far; fuzzy matching in Power BI, and fuzzy grouping. the methods above involve transforming the data with a fuzzy operation. However, sometimes you just want to know the similarity of values, or let’s say in other words; find the clusters. Finding the clusters may help you in further transformation. This operation can be done using Fuzzy Clustering in Power Query inside Power BI. Let’s see how it works.
Video
Sample input and requirement
Let’s say we have a table like below;
“source” table which is the data of employees and their departments. Notice that the Department field has data quality issues. we have department values such as “Sales”, and “Sale”. Or another example is “Managmnt” and “Management”.

We want to find out how similar values are to each other, or let’s say; how many clusters of similar values we have.
Power Query Online
At the time of writing this article, this option is only available in Power Query online. It surely will be available in other Power Query options on desktop such as Power BI Desktop and Excel in the future. But if you want to try it and online is the only option, it means you need to create a new dataflow inside an organizational workspace for it;

Once you created a dataflow, you can use the add new table

This would get you to the Get Data experience to connect to any data sources you want.
Fuzzy Clustering
Performing fuzzy clustering is very similar to fuzzy grouping with the difference that the output is not grouped.
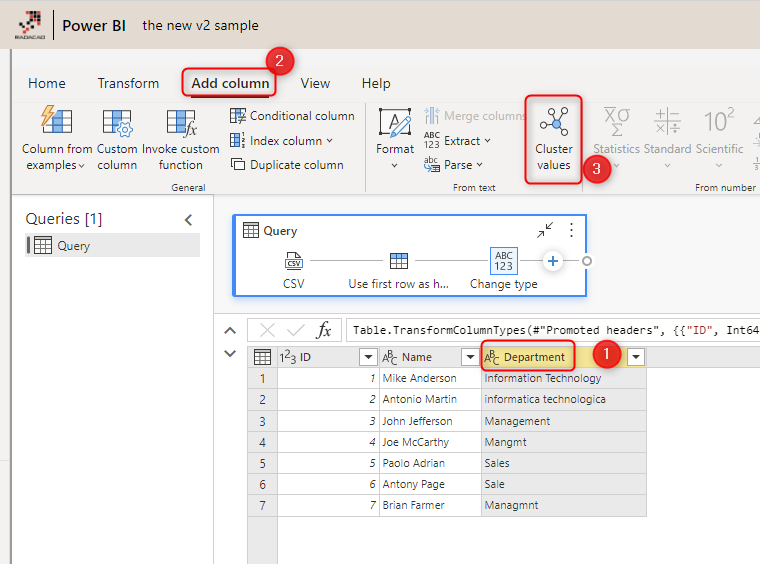
To perform a fuzzy clustering; go to Add Columns in the Power Query Editor, and select the Cluster values. Remember that you have to select the column on which you want to perform clustering beforehand.
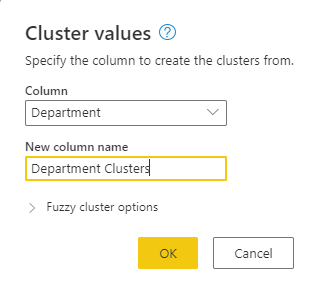
You can simply then set a name for this new column, and click on OK.
This simply gives you an output as below with a new column showing the cluster values;
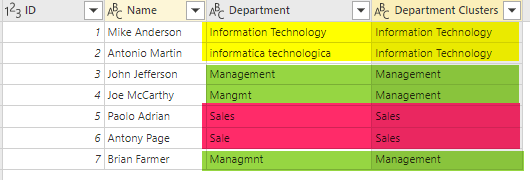
I have color-coded the result above so that you can understand it simpler. There are three cluster values in the Department Clusters column; Information Technology, Management, and Sales. Power Query finds out that the values in the Department column are similar to these three main clusters.
Similarity Algorithm
This is possible because Fuzzy clustering uses an algorithm to find the similarity threshold of text values. The algorithm is based on Jaccard Index, which is explained here.
Performance Aspect
Be careful whenever you use Fuzzy Merge, Fuzzy Grouping, or Fuzzy Clustering. Any fuzzy operation on the dataset will bring a huge performance impact to the data processing. The reason is that every text value has to be compared with every other text value in the table, the similarity threshold of the two has to be calculated (based on the algorithm above). This process is a very time-consuming process. Especially with more rows in the data table, you will feel it much more.
Fuzzy cluster options
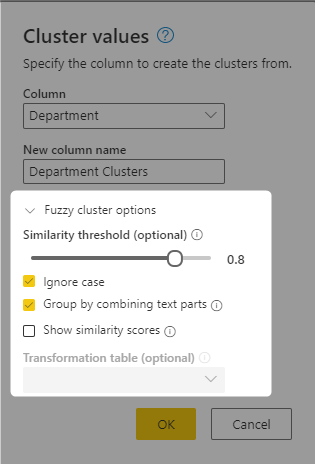
If you want to customize the fuzzy clustering’s setting, you can expand the fuzzy options.
Show Similarity Scores
This option is perhaps the most useful thing in fuzzy clustering. You like to know the cluster values, but most importantly, you like to know the similarity of each value to the cluster value. That is why the show similarity scores will do.
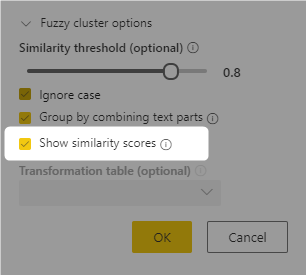
It will add a new column to your output with a similarity score between 0 to 1.

The similarity scores are very helpful. It helps you to fine-tune the next similarity threshold based on your data values. I often use this option myself before applying fuzzy merge or fuzzy grouping.
Similarity threshold
The default threshold for Fuzzy clustering is 0.8, which means 80% similarity.
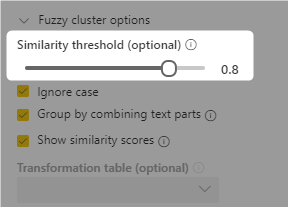
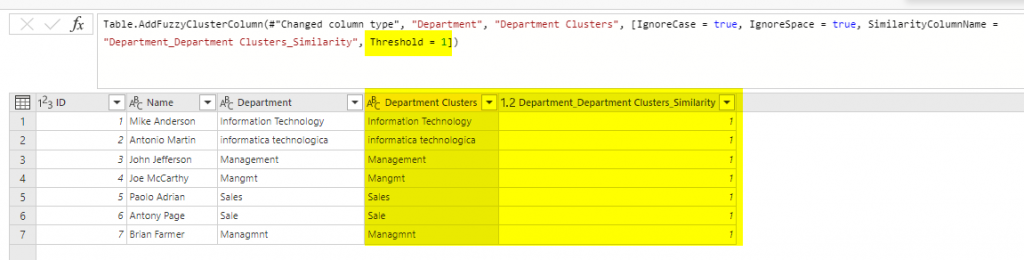
You can change the options such as Ignore case, or Similarity threshold. For example, if I change the similarity threshold to 1, It means 100% matching.
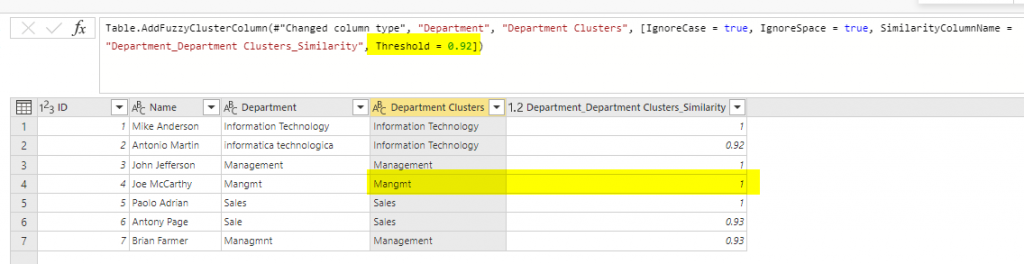
The lower the similarity threshold the more matching of non-similar values. For example, 0.92 similarity threshold will give me the below
If you want to set other settings for the Fuzzy clustering here is what they mean;
| Option | Acceptable Value | Description |
| Threshold | a value between 0.00 to 1.00 | if the similarity of the two text values is more than the threshold it will be considered as a successful match. Value 1.00 means exact match. |
| Ignore Case | true/false | If you want the similarity algorithm to work regardless of the upper or lower case letters, then select this option. |
| Group by combining text parts | true/false | If you want the similarity algorithm to work regardless of the number of spaces in the text, then select this option. |
| Transformation Table | table | This is like a mapping table, let’s check it out a bit later in this post. It gives you the option to use your own mapping table. This table should have at least two columns of “To” and “From”. |
Power Query Functions
In addition to the option added in the graphical interface of Power Query, we also have a Power Query Function that does the Fuzzy clustering:
Table.AddFuzzyClusterColumn
If you use these two functions directly in the M script, you will have some parameters to set;

Transformation Table
Sometimes in the merge operation, you need a mapping table. This table is called here a Transformation Table. Here is an example of a mapping table:

Note that this table should have at least the two-column of “To”, and “From”. And don’t forget that Power Query is case-sensitive!
Now you can select this table in your Merge operation in the Fuzzy configuration as below;

This process is like merging the “source” table, which is the first table in our Merge, with the “Department” table based on the “Department” and then “Department Name” column, then merging it with the “mapping” table, based on the “To” column and “Department Name”. The output will bring the “To” column of the mapping table. Here is the sample output:

Summary
Fuzzy Clustering is normally the step I do myself before fuzzy grouping or fuzzy matching. the showing similarity scores can help you to fine-tune the similarity threshold, and then use that to perform further operations. Fuzzy clustering is easy to apply, however, it comes with a performance cost. Ideally, you have to make sure the data comes clean before doing the transformation. Which means applying the right process to get the clean data. However, sometimes when you need the transformation, you can use it. In this article and video, you learned about that. I strongly recommend you to read the two other articles below too:
- Fuzzy Matching in Power BI and Power Query; Match based on Similarity Threshold
- Fuzzy Grouping in Power BI using Power Query


Reza is author of more than 14 books on Microsoft Business Intelligence, most of these books are published under Power BI category. Among these are books such as Power BI DAX Simplified, Pro Power BI Architecture, Power BI from Rookie to Rock Star, Power Query books series, Row-Level Security in Power BI and etc.
He is an International Speaker in Microsoft Ignite, Microsoft Business Applications Summit, Data Insight Summit, PASS Summit, SQL Saturday and SQL user groups. And He is a Microsoft Certified Trainer.
Reza’s passion is to help you find the best data solution, he is Data enthusiast.
His articles on different aspects of technologies, especially on MS BI, can be found on his blog: https://radacad.com/blog.