

I have previously explained how to generate a row-number using Power Query. That method is good for pre-calculating row-numbers in the table. However, sometimes, you want to calculate the row number in a visual, based on something dynamic. That is where DAX comes handy. Let’s see how this is possible.
Sample model
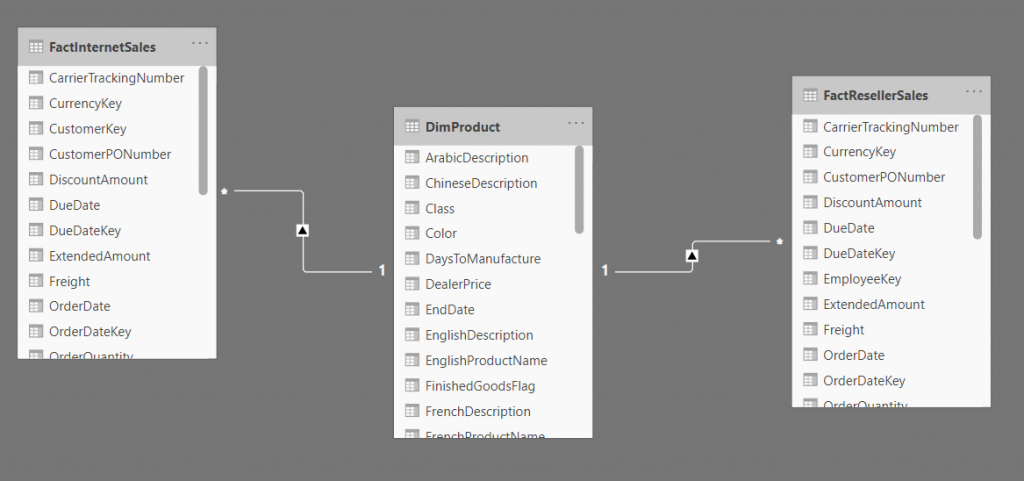
I have a simple model with three tables below;
I also have a couple of measures for the SalesAmount for each of the fact tables;
Internet Sales = CALCULATE(SUM(FactInternetSales[SalesAmount]))
Reseller Sales = CALCULATE(SUM(FactResellerSales[SalesAmount]))
Now imagine that we want to have a visualization like below that shows all the products, and their Internet Sales;
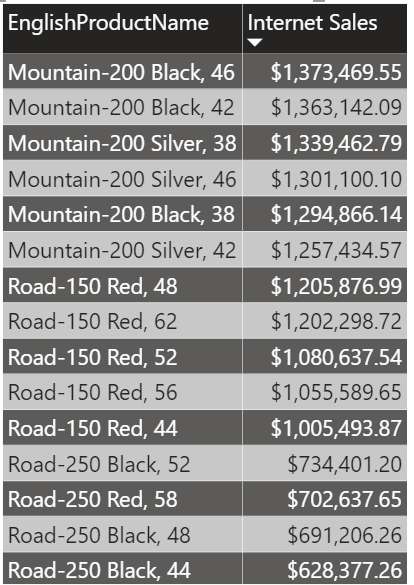
In the above visualization, I want to calculate the row number based on the Internet Sales.
Row Number Using RANKX
RANKX is a very useful function in DAX for many scenarios, one of those is to calculate the row number based on an expression. RANKX has two mandatory parameters and some optional parameters. the mandatory parameters are; the table or column in which we have the list of all items, and then the expression which you calculate the index based on it.
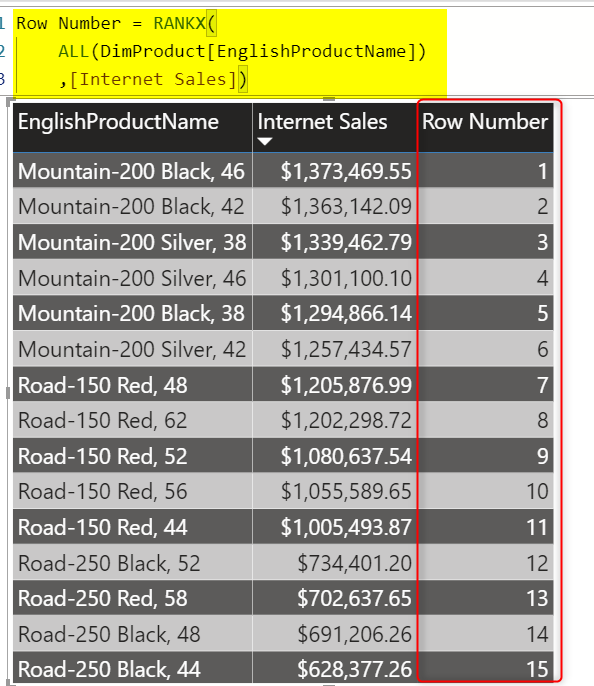
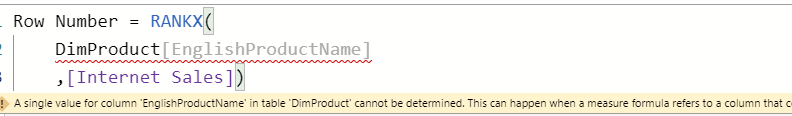
If I want to calculate a row number based on the Internet Sales, my expression can be like below;
Row Number = RANKX(
ALL(DimProduct[EnglishProductName])
,[Internet Sales])
The expression above returns the row number as an index descending by the value of Internet Sales for each EnglishProductName.
That was easy, wasn’t?
Understand How to Use RANKX for Row Number
Now let’s see how you can do that in your Power BI solution. Let me guide you through the parameters you need to set for the RankX function;
1st parameter: Table
The first parameter should be a TABLE. This can be a physical table in your model, or a virtual table (a table generated by tabular functions). You notice that I used ALL(EnglishProductName). You might wonder Why ALL is used?
Imagine we are looking at one row in the table visual. If you pass just the table name in the first parameters, it means only the rows in that table which fits into the current filter context, which means the current product only. So you are ranking a single product, not the whole table. the result would be always 1!
Now, if you use ALL, it means even if you are in the context of the current row, the indexing will happen on the entire list, which will lead to the correct result.
Can’t I use a column only?
No. This parameter has to be a table. A column is not representative of a table.
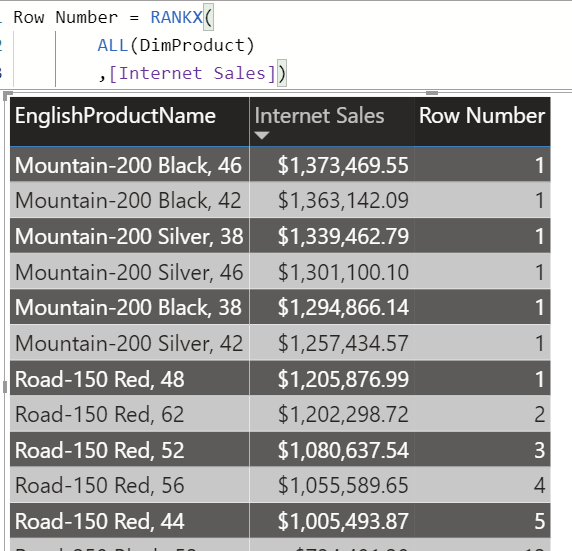
What if I say ALL of the table?
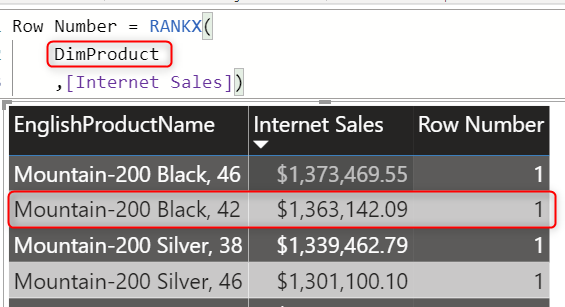
That is a possible option, but then you have to consider having a column in the visualization that is the same granularity as the table. The EnglishProductName is not that column, because we have multiple rows in the DimProduct table with the same EnglishProductName (their color or other columns might be different). This means an expression like below:
Row Number = RANKX(
ALL(DimProduct)
,[Internet Sales])
Will not show the value you expect in the below context;
But it works perfect in a context of ProductKey;
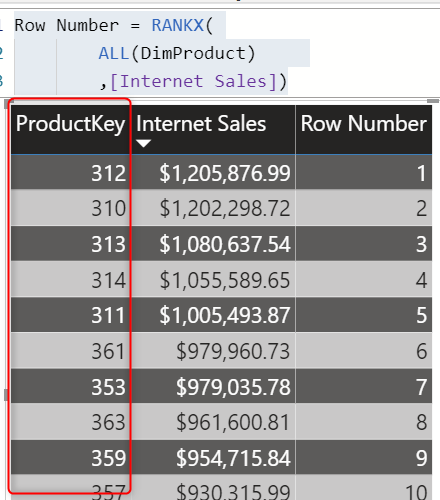
The reason is that we have the index done at each row level (when we said ALL(DimProduct)), and ProductKey is the only column that has a unique value per row.
What if I have more than one columns?
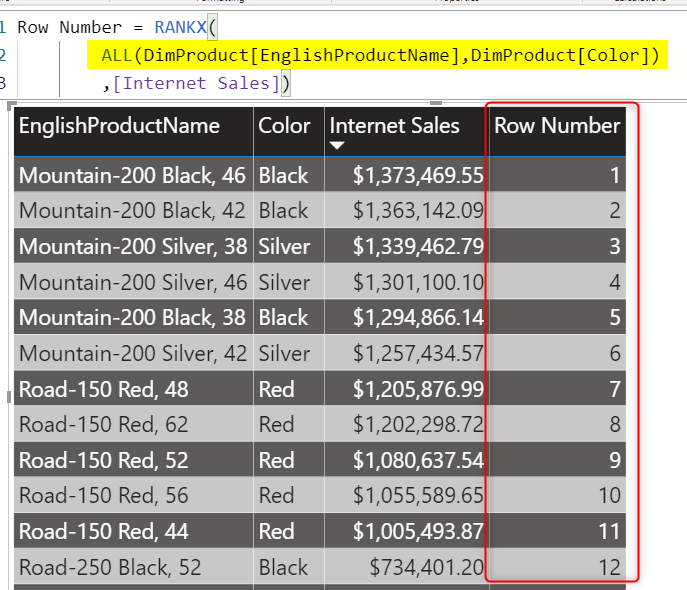
You can have combinations of columns in your row number calculation. here is an example of how it works for the EnglishProductName, and Color;
Row Number = RANKX(
ALL(DimProduct[EnglishProductName],DimProduct[Color])
,[Internet Sales])
You can have multiple columns inside the ALL function. The result is as below?
Is ALL the only function that works?
No. you can use many other functions, the main thing to remember is that you need to use a function that gives you a list of unique combinations of values you want to create the index for.
2nd Parameter: Expression
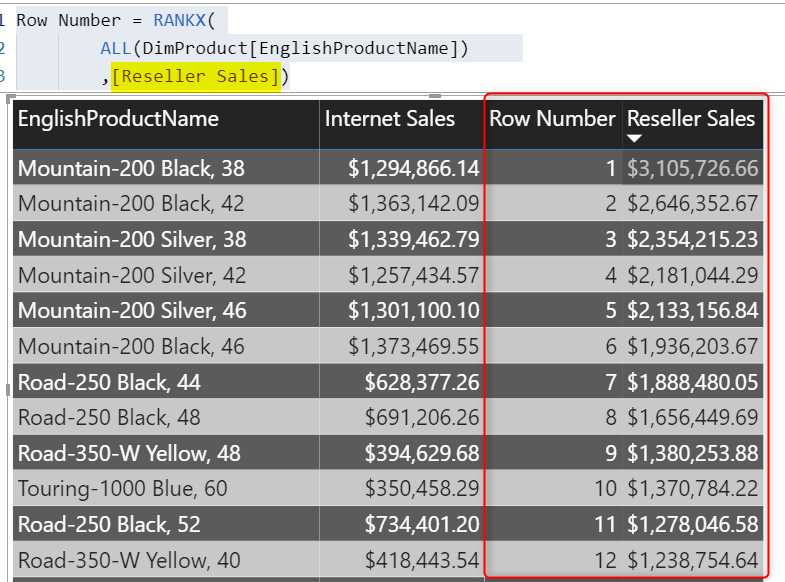
The second important function is the expression. The row number is based on what value? Internet Sales or Reseller Sales? The below example returns a row number based on Reseller Sales.
Row Number = RANKX(
ALL(DimProduct[EnglishProductName])
,[Reseller Sales])
and here is the result;
There are other parameters for this function too, but explaining them will be outside of the topic of this post which is focused only on the row number.
Summary
RANKX is a function that you can use to calculate the row number dynamically in a measure in Power BI. If you want to calculate the row number not dynamically though, I strongly recommend doing it in Power Query or the data source. Feel free to let me know if you have any questions.
Download Sample Power BI File
Download the sample Power BI report here:
Video


Reza is author of more than 14 books on Microsoft Business Intelligence, most of these books are published under Power BI category. Among these are books such as Power BI DAX Simplified, Pro Power BI Architecture, Power BI from Rookie to Rock Star, Power Query books series, Row-Level Security in Power BI and etc.
He is an International Speaker in Microsoft Ignite, Microsoft Business Applications Summit, Data Insight Summit, PASS Summit, SQL Saturday and SQL user groups. And He is a Microsoft Certified Trainer.
Reza’s passion is to help you find the best data solution, he is Data enthusiast.
His articles on different aspects of technologies, especially on MS BI, can be found on his blog: https://radacad.com/blog.
This is something that has always annoyed me with Power BI, so thanks for your thoughts on this. Still, it’s waaaaay more complicated and much harder to implement than it ought to be.
I’m PowerQuery there’s a button to add an index. And I think something simple like that would be a good addition to the Table visual in Power BI.
Yes, I agree with you.
I do believe something would be added in the future to make it much easier
Cheers
Reza
This works great, thanks. However, if my table has a row for totals, this column also shows “1”, which is weird. Is there a way to hide this in the totals?
Yes, You can use the approach I mentioned in this article to do that
Cheers
Reza