

DAX is the analytical language in Power BI. Learning this language, however, comes with some difficulties. Part of that challenge is the way that functions work in DAX. Learning the output of functions is an important element of learning how and where you can use them. In this article, I’ll explain two types of outputs for DAX functions, and ways that you can use them.
Scalar Functions
Scalar function in a function that returns one single value. This value can be of any data type; Date, Numeric, Text, etc. But it is always one single value. One of the most basic and simple functions in this category is SUM.
Consider the measure below:
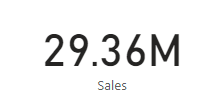
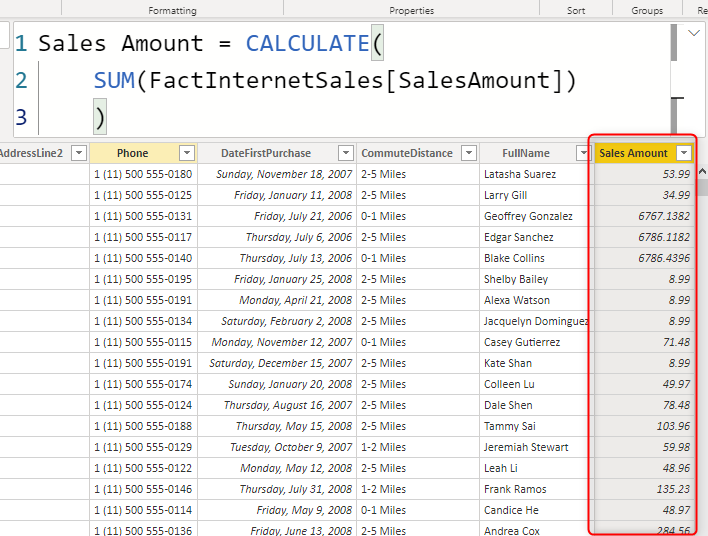
Sales = Sum(FactInternetSales[SalesAmount])This calculation will return one single value. Depends on where you use it in the report actually, but here you can see that it returns the total sales:
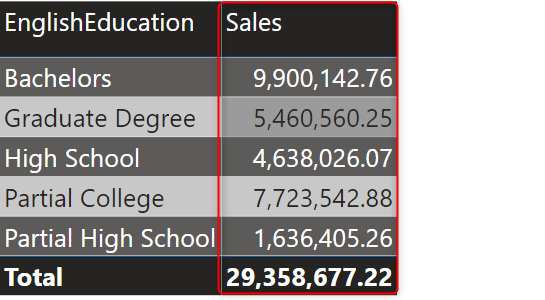
If you use it in a table, however, you will see multiple results. But in fact, that is one result, per the filter combination applied in the table.
We have many Scalar functions in DAX, here are a few examples:
- SUM/Average/Min/Max
- SUMX/MinX/MaxX/AverageX/CountX
- LastDate/FirstDate
- Calculate
- Related
- …
You can use these functions directly in a Measure or Calculated Column. If you don’t know the difference between these two, read my article here.
If these functions are used in a Measure, then you will see the result of the measure in the visual. If they are used in a calculated column, you will see the result of those in every row of the table;
Tabular Functions
Some functions return a table as the output, not a single value, a whole table. The table can have multiple columns or just a single column depends on the function used. But it would be a table structure with multiple values in it.
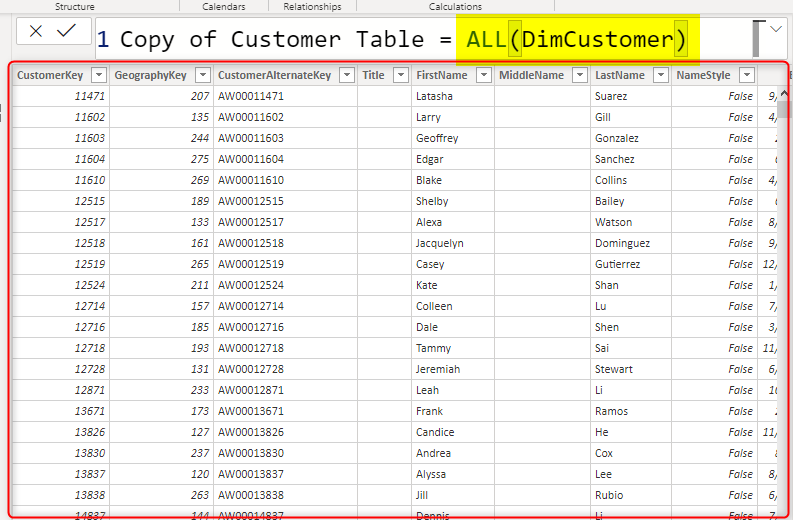
One of the most simple tabular functions is ALL. All is a function that returns the entire table without any filters applied (if just the table passed as the input with no changes).
Copy of Customer Table = ALL(DimCustomer)The expression above, as a Table, will return the below result;
There are many tabular functions in DAX, here are a few;
- ALL, AllExcept
- RelatedTable
- SamePeriodLastYear
- DatesBetween/DatesInPeriod
- Summarize/GroupBy
- TreatAs
- ….
You can use these functions mainly in a calculated table. To learn more about the calculated table read my article here.
Miss-Use of the Functions
So far, everything seems simple. The first problem appears when you want to use a function in a place that you shouldn’t. For example, if you use a scalar function to build a calculated table! or use a tabular function to return the main result of a DAX measure!
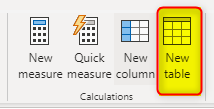
Scalar Function to Create a Calculated Table
This won’t work. a function that returns one single value, cannot build a table.
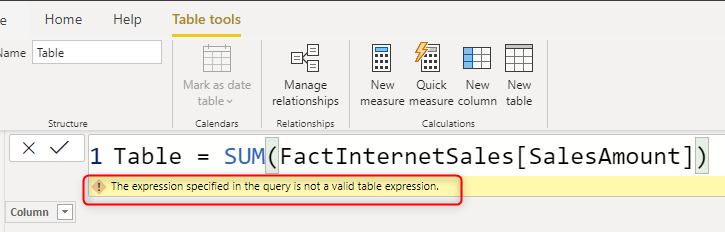
If you do this action, you will get the error saying: “the expression specified in the query is not a valid table expression.”
That is because the Calculated table expects a table expression, which only comes from tabular functions.
Tabular Functions to Return the output of a Measure or Calculated Column
another miss-use of the functions is when you use a tabular function directly in a measure or calculated column to return the output.
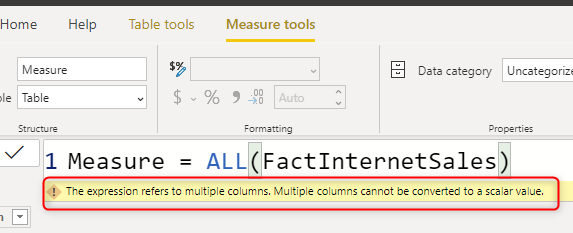
If you do this action, you will get the error “The expression refers to multiple columns. Multiple columns cannot be converted to a scalar value.”
This is because the function returns a table, and the measure expects a single value.
What can You DO?
DAX is a language of nested functions. One function can be input of another function. So, in fact, you can use scalar functions to build a calculated table, or you can use tabular function to create a measure, you just need to know how. Here is the guidance.
Using Tabular Functions in Measures
although you cannot use the tabular function result as the main result of the measure, you can use that as an intermediate result used inside a scalar function.
The expression below, is calculating the sales of the same period last year;
Same Period Last Year =
CALCULATE(
    SUM(FactInternetSales[SalesAmount]),
    SAMEPERIODLASTYEAR(
        FactInternetSales[OrderDate].[Date]
    )
)
The expression below is written as a measure, yet, you can see that I have used the SamePeriodLastYear in it which is a tabular function.
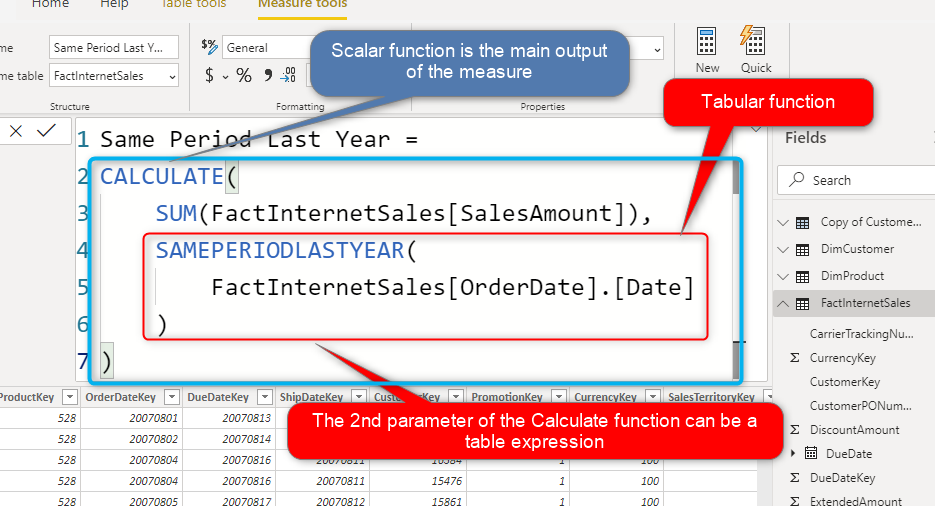
As you can see in the above screenshot, the result of the SamePeriodLastYear (which is a tabular function) is used as the 2nd parameter of the Calculate (which is scalar function). And because the main output of the measure is coming from the function the is the direct result of the measure, it works perfectly fine.
Using Scalar Functions in Calculated Table
You can use the same approach and cascade scalar functions inside a tabular function.
GroupBy - with aggregation = GROUPBY(
    DimCustomer,DimCustomer[EnglishEducation],
    "Row Count",
    COUNTX(
        CURRENTGROUP(),
        DimCustomer[CustomerKey]
        )
    )
The expression above uses the CountX, which is scalar function, inside the GroupBy as a parameter. And the GroupBy is a tabular function. If you look more in details, you will also see that the CurrentGroup function is another tabular function nested inside the CountX.
The key understanding from the examples above is that functions should be used in the places that their output type is expected.
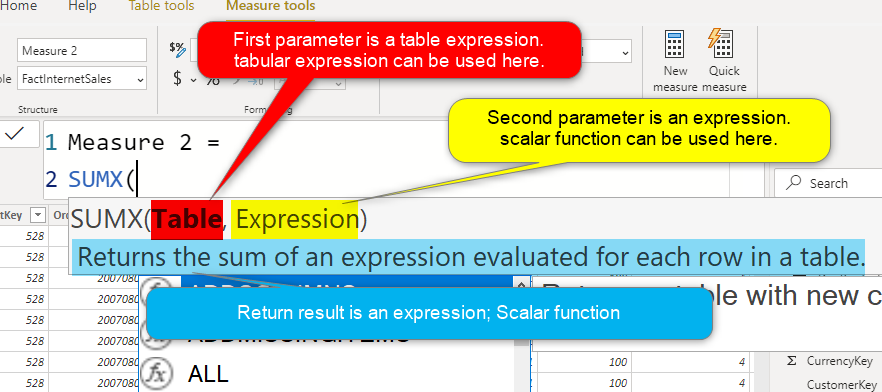
How Should I Know Where to Use Each Function?
This is a very fair question. Always look at the definition of the function, or use the MSDN Docs. For example, here is the definition of the SUMX Function;
The Docs would also guide you to the same thing;
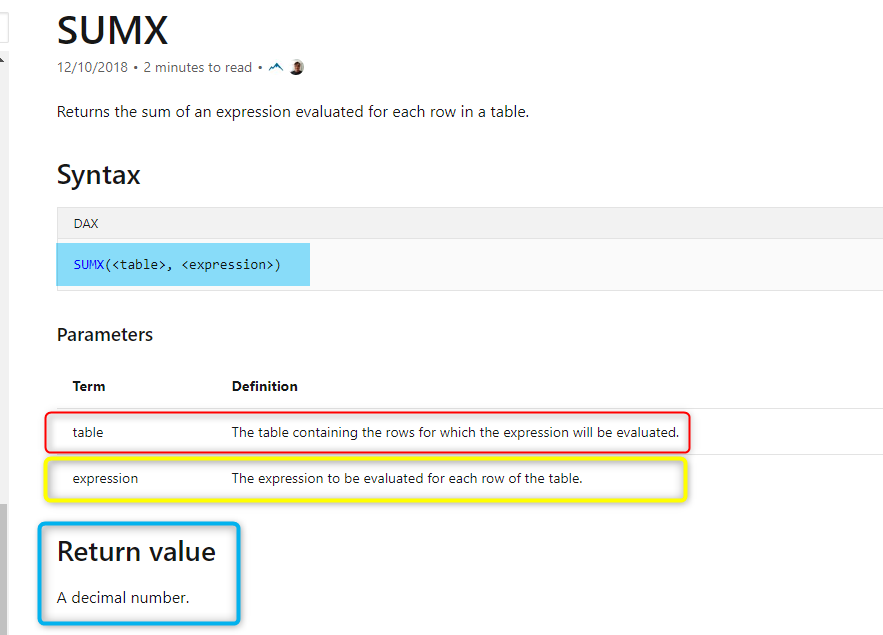
Not all functions have a very good definition guide, but most of them have it.
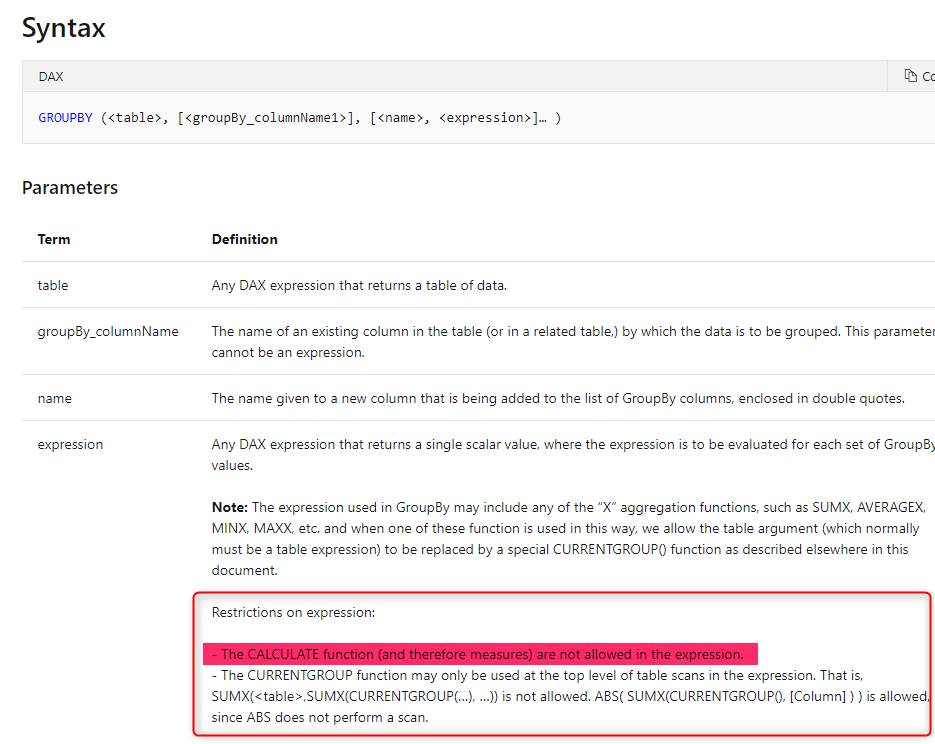
Restrictions
There are some functions that can be used only in a specific context. For example; The Calculate returns a scalar value, but it cannot be used inside a GroupBy function. That is the limitation of the GroupBy function.

You will find restrictions like these in some functions, however, mostly you will find the docs that explain the restriction.
Exceptions
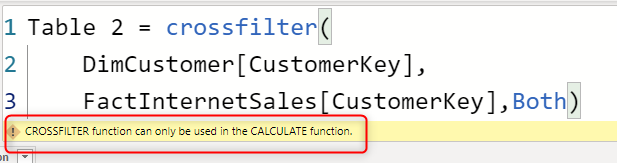
There are functions that are neither tabular nor scalar. They don’t return an output. For example, the CrossFilter function is changing the behavior of a relationship, and can be used only inside a Calculate Function.
Summary
Understanding DAX requires you to change your mindset from programming languages or even expression languages. the difficulty is mainly understanding the filter context. However, another part is understanding the output type of each function. You should know how and where to use tabular or scalar functions in DAX. In this article, you learned that you can nest these functions inside each other in the right way, but always keep an eye on restrictions and exceptions.
Video


Reza is author of more than 14 books on Microsoft Business Intelligence, most of these books are published under Power BI category. Among these are books such as Power BI DAX Simplified, Pro Power BI Architecture, Power BI from Rookie to Rock Star, Power Query books series, Row-Level Security in Power BI and etc.
He is an International Speaker in Microsoft Ignite, Microsoft Business Applications Summit, Data Insight Summit, PASS Summit, SQL Saturday and SQL user groups. And He is a Microsoft Certified Trainer.
Reza’s passion is to help you find the best data solution, he is Data enthusiast.
His articles on different aspects of technologies, especially on MS BI, can be found on his blog: https://radacad.com/blog.