

As another section of the Power BI online book: from Rookie to Rockstar, I would like to get start working with Power Query. From my point of view learning through an example is the best way to learn new technology. For this post I have decided to use movie’s data to be mashed up. I used this example because movie’s data is a fun example at the early sections of the book, you all watch movies, and you will see many familiar titles here. If you want to learn about Power Query or you need a Power Query introduction before this example, read the previous post: What Is Power Query? Introduction to Data Mash up Engine of Power BI.
Video
You can use either Power Query for Excel or Power Query as part of the Power BI Desktop for running this example. I use two data sets for this example:
- Worldwide gross sales information of movies
This information are available in http://www.boxofficemojo.com website, as below:

- Top 250 movies ranked by people in IMDB website
IMDB is the movie database on the internet that users can rate movies. list of top 250 movies rated by users listed here in the website as below:

Let’s Get Started
Start by getting gross sales data; Open Excel, then Power Query Tab, and then from Web;

Or Open Power BI Desktop and Get Data from Web

Then Enter the web page URL for top 100 sold movies all the time from this link: http://www.boxofficemojo.com/alltime/world/

Click OK, after a quick processing, you will see a Navigator window. Power Query will check for any tables in the html web page and will come back with a list of tables on the left side under the URL address;

Click on Table 0. You will see a preview of data in the table in main pane. Now tick the checkbox for Table 0 and click on Edit button in Navigator

Query Editor
After clicking on Edit you will see the Query Editor window opened. This is an editor that you will spend most of your time for data mash-up here.

Query Editor has four main sections (numbers matched to screenshot above);
- Main data set pane; This is the central area that the result set will be displayed as preview with limited number of rows
- List of Queries; Left hand side pane will show list of all queries in this solution or file
- Query Settings pane; Properties such as Name of the query can be set here. Also list of all applied steps to the current query is visible in this pane.
- Transformations Menu; Power Query has many transformations options in GUI that are available through the menu in top section
Rename the existing query to Top Sales 100

Our goal in this example is to join the data set of global gross sales with the IMDB user rating, and then analyze to see are best sellers in movie titles among the best rated movies or not? so the more data in gross sales we get would give us better analysis. The above URL only gives us top 100 sold movies. but the option to go to pages for rest of the result set are available;

So Let’s add list of movies from 101 to 200 in best sellers;
In the existing Query Editor window go to New Source, and then choose From Web. Enter the URL as : http://www.boxofficemojo.com/alltime/world/?pagenum=2&p=.htm

This will lead you to the top second 100 movies sold. Click on Table 0 in navigator window and then OK. in the Query Editor rename this query as Top Sales 200

Follow this process for links below;
http://www.boxofficemojo.com/alltime/world/?pagenum=3&p=.htm
http://www.boxofficemojo.com/alltime/world/?pagenum=4&p=.htm
…
Bring data for all top 615 movies in Power Query

As you see in query editor all of these queries are separate from each other. Let’s combine them altogether. in database and SQL world that can be done with UNION. Here in Power Query we can do Append Queries;
Use a Query as a Reference
First Create a reference from Top Sales 100 (because for this example I want to keep that query as is);
Right click on Top Sales 100, and from the pop up menu choose Reference

This will create a new query that users Top Sales 100 as the source (or reference). Rename this new query to be just “Top Sales”

Append Queries
Now let’s combine queries into this new query;
Click on Top Sales and then from the menu (Home) click on Append Queries

For append to work you need two queries; the first query is the query that you are on it (Top Sales), the second query name should be entered in the Append dialog box;

as you see in screenshot above you can choose other queries. For append to works best queries have to be in the same structure (number of columns, order of columns, data type of columns….). Choose Top Sales 200 in this window and click OK. This will create another step in the query setting named Appended Query. and the result set in the main pane (if you scroll down) will show you first top 200 movies sold.

Continue this process to add all 615 top movies into Top Sales query.
Extract First Characters
After doing this change Let’s clean the Year column data; Year column has an special character in some values as below;

Click on Year Column, and then from Transform menu under Text Column click on Extract, and then choose First Characters

Enter 4 in the Extract First Characters dialog box (because year isn’t more than 4 characters). then click on OK.

You will see that year column is clean now without any extra characters.That was easy data transform, wasn’t it? This option in the transformation menu (Extract First Characters) has been added recently in Power BI Desktop.
You can even now change data type of this column to whole number. Right click on Year column and then under Change Type choose Whole Number.

Great We’ve done enough with the first data set. Let’s work on the second data set (IMDB user rating);
Go to Home Tab in Query Editor again, and Get data from the New Source and from Web. Enter the URL as: http://www.imdb.com/chart/top
In the Navigator window, Table 0 contains the data that we want, so load it with clicking on OK. the data loads into Query Editor as screenshot below illustrates

Rename the query to IMDB Rating.
Remove Columns
You can see that there are three useless columns in the data set; first column, and last two columns. remove these columns simply by clicking on them and then right click and Remove.

Split Column
Now in the result set we have two columns; Rank & Title, and IMDB Rating. Rank & Title is a combined column which contains rank, title, and year of the movie. Let’s split these values;

Rank is separated by single dot (.). So we can use Split Column transformation to split it easily; Right click on Rank & Title column first. then Choose Split Column, and then By Delimiter

In the Split Column by Delimiter dialog box you can choose one of the common delimiters such as comma or color … or you can use a custom delimiter. Set it to Custom, and enter single dot (.) in the box underneath. You can also specify how the split works. The default option is At each occurrence of the delimiter. This default option might not be best for our case, because sometimes there might be a dot in the movie’s title. So select the split method as At the left-most delimiter. This option will scan text from the left, and will stop splitting after finding the first delimiter.

after split the result set would look like below;

Rename the Rank & Title.1 column to Rank.
Now Let’s split title and year. Year value is surrounded between brackets, so we can use same split column method, this time using open bracket as below;

The result set looks like below screenshot;

Replace Values
Rank & Title.2.2 column has the year value with an extra close bracket. Click on this column and then from Transform menu under Any Column click on Replace Values

Replace close bracket with an empty string as below;

Result set would have the close bracket removed. rename the column to Year, and change it’s data type to Whole number (change data type with right click on the column)
Trim
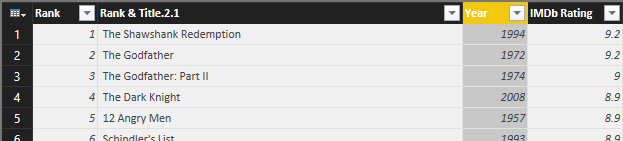
Also rename the Rank & Title.2.1 column to Title. Because this column might have extra spaces at the beginning and end of values (as the result of split column steps), let’s remove extra spaces;
right click on this column and then under transform choose Trim. this will remove all heading and trailing spaces from values in this column.

Awesome, our work with this data set has been finished as well.
Applied Steps
One of the most useful sections of Query Editor window is Applied Steps in the Query Settings Pane. This section of Query Editor window is very useful for debugging and tracking steps and changes. You can see all the steps that you’ve applied on the current data set in this pane. And this is not all of it! You can click on an step and the main pane will show you the data at that step! such an awesome way of keeping track of steps.

You can even remove an step, or you can change settings of an step with clicking on remove icon (on the left side of step) or setting icon (on the right side of the step, but only for steps that settings is applicable to them).
Final Merge
We’ve prepared both data sets for a final merge together to see how best selling movies are among top user rated films. So we are one step away from this result. we have to merge these two data sets, or Join them in other word.
Click on Top Sales query and create a reference of it, name the new query as Merge Result. Now click on Merge Result, and then from Home tab, under Combine choose Merge Queries

Merge Queries is equivalent to Join in SQL or database terminology.
Merging queries requires two queries; the first query is the query that you are currently on it (Merge Result), and you can choose the second query in the Merge dialog box. Choose second query as IMDB Rating. Now select joining keys as Title (you can also choose multiple joining columns with pressing ctrl keyboard key). Set also join kind to Left outer join (this will only select all records from the first query with matched rows of that from the second query)

Notice in screenshot above that merge dialog mentioned only 58 records out of 615 movies matched! it means only 58 of best seller movies are among top user rated list! such a pity. Screenshot showed only Inner Join result, but you choose Left Outer and then click on OK to look at the data;
Joining experience in Power Query is a bit different from database tables. as a result of join you will get first table with a new column for the new table. This new column holds table values which needs to be expanded. If you click on the column header icon, you can choose which columns of the nested table you want to expand.

Let’s keep all columns and click OK. You can now see some movies that are among best sellers but not in top 250 user rated list of IMDB, There are movies name ssuch as Iron Man 3, Skyfall, Furious 7 and list goes on. Play with that yourself to see what you explore!

Summary
In this section you’ve learned basics of Power Query through an example. You’ve seen how Power Query can analyze tables in a web page and load it into query editor. You’ve experienced Query Editor and you’ve learned how to apply some transformations. You’ve learned that transformations such as split column, replace values, change data type, and extract part of a text are easy transformations that can be simply done through Power Query editor. In next sections I will explain different types of data sources that Power Query or Power BI can work with through the Get Data Experience. You will see that Power Query and Power BI can get data from text files such as CSV, Text as well as database connections such as MySQL, Oracle and SQL Server, it can also bring data from on-premises data stores as well as cloud Azure based services.


Reza is author of more than 14 books on Microsoft Business Intelligence, most of these books are published under Power BI category. Among these are books such as Power BI DAX Simplified, Pro Power BI Architecture, Power BI from Rookie to Rock Star, Power Query books series, Row-Level Security in Power BI and etc.
He is an International Speaker in Microsoft Ignite, Microsoft Business Applications Summit, Data Insight Summit, PASS Summit, SQL Saturday and SQL user groups. And He is a Microsoft Certified Trainer.
Reza’s passion is to help you find the best data solution, he is Data enthusiast.
His articles on different aspects of technologies, especially on MS BI, can be found on his blog: https://radacad.com/blog.
Great post!
Very clear and intuitive. Waiting for next episode 🙂
Thanks Nir for your feedback and kind words.
Cheers,
Reza
Great article. Thank you
Would love to see advanced version (part 2) that can iterate thru all available pages to get all the movies without pre defining the number of pages
Thanks
Hi Reza,
Thanks for such a comprehensive Web query example and I am now gonna love with Power BI features especially Power Query.
Hi Asif,
Thanks for your feedback, Glad that you found it useful.
Cheers,
Reza
Great article as others have mentioned. May I suggest two corrections, as per below:
In the section Append Queries it states “Double click on Top …..” should this not be “Single” click?
In the section Final Merge “Set also join kind to Left Outer …” but the screen shot shows “Inner” under Join Kind. This may be just my ignorance about joins so this may not be an issue.
Cheers!
Peter
Hi Peter,
Awesome, thanks for mentioning those points, corrected now. Thanks for peer reviewing 🙂
Cheers,
Reza
A well worked example, even though now nearly a year old, but still very relevant. I would’ve liked a bit more at the end though: suggested names for the appended columns, how to return the data to Excel, and how do you re-use the recorded steps. Do they run when fresh/updated is loaded in – and how do you do that?
Hi Mike, Thanks for your kind words and great feedback. Will probably write a post about future steps as you mentioned plus a bit more.
Cheers,
Reza
So… how can we use Power Query to pull from a sheet of IMDB numbers (tt0049875 for example) some details PER title? I have most data, but want to pull IMDB score and maybe top three actors.
You need to use URL parameters and custom functions for doing that.
Great working example. It worked in Excel 2013. But with Excel 2016, I often got Express.Error: The column ‘”2″>Overseas /%’ of the table wasn’t found. Any idea why it happened and how to fix it?
Thanks,
Xavier
Hi Xavier.
This normally means the query is looking for the column titled “2>Overseas /%” and can’t find it. Check your previous steps, maybe the column removed somewhere before, or the header(column name) is different and change it in the script.
Hi Reza,
Thanks for your reply. I didn’t change any column names during the process. The odd thing is that Excel 2016 can get the data from the website in the first try. Then if you want to refresh the data, you will get the error. I tried this in Excel 2013, it worked. But in Excel 2016, it seems having problems. The column names seems being generated by Excel 2016 since for the Domestic Sale and Percentage, there is only one column (span=2). But the Excel generates two columns one for sales and another for percentage. It is the same for Oversea Sales and Percentage.
I tried to change the column names in Advanced Editor for the query. I didn’t have any luck so far. Any idea?
Thanks,
Xavier
Can you share you M script for Excel 2016 and 2013 please? to find M script click on Advanced Editor in Query Editor window