
Microsoft Fabric comes with many objects that can enhance your data analytics experience. One of those objects which comes from the Azure Data Factory is Pipeline. For those using Power Query Dataflows, you may think you already have everything you wanted there, but Pipeline certainly has more to offer and complement the experience. In this article and video, I’ll explain the Pipeline in the Microsoft Fabric Data Factory, and you will see a simple example of it in action.
Video
What is Data Pipeline? Or Data Factory Pipeline?
The Pipeline comes from Azure Data Factory. A Pipeline is a group of activities bundled together into a workflow. For example, a Pipeline can generate a process around the Dataflow. For example, you may want to run a Dataflow in a loop until something happens, and with the failure or success of each execution, you want to perform a task such as sending out an email, copying data somewhere, running a stored procedure, etc.
If you are familiar with SSIS (SQL Server Integration Services), then the Data Pipeline is like the Control flow, whereas the Dataflow is the Data Flow.
In some ways, Data Pipeline can be similar to Power Automate. However, there are things that you can do using the Data Pipeline which are not easily possible in Power Automate. The main thing to know is that the Data Pipeline is created for Data Factory to enable moving data at scale. So it comes with the activities such as Dataflow Gen2, Delete data, Fabric Notebook, Fabric Spark job definition, etc.
Data Factory with Transformation Engine of Dataflow
One of the best things about Data Pipelines is that it brings the transformative power of Dataflow into the Data Factory. For many years, Data Factory has been more of a data ingestion tool, and then with the ability to use SSIS in Data Factory, we could do transformations, but still, it was nowhere close to the simplicity of how transformations are done in Power Query. Now in Microsoft Fabric, these two come into one place; You can create a Data Factory Pipeline that runs a Dataflow Gen2 as one of its activities and, before or after that, run other activities.
Data Pipeline VS. Dataflow?
You may ask, “What is the difference between Data Pipeline and Dataflow? Are they both doing the same thing? Should I be using one over the other?” Here I am answering that question.
Dataflows and Data Pipelines are not replacements for each other but complement. Dataflows are for data transformation. They use Power Query transformations to get the data from the source and bring it in the shape and format needed to the destination. Data Pipelines are for controlling the flow of execution. They use Control flow activities such as loops, conditions, etc., to put the data transformations in a bigger context of an ETL job.
How to create a Data Pipeline?
Now that you know what a Data Pipeline is, let’s create a simple example.
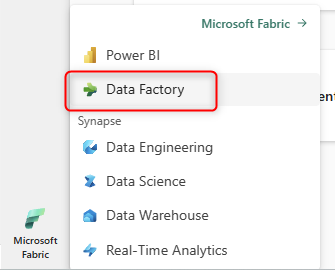
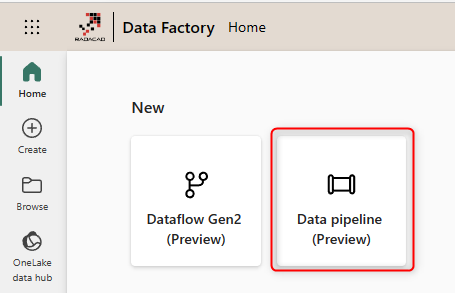
Let’s start this by creating the Data Pipeline. Data Pipeline can be created in the Microsoft Fabric portal under the Data Factory workload.
Once in the Data Factory portal, click on the new Data Pipeline.
After setting a name for the Data Pipeline, you will be navigating to the Pipeline editor.
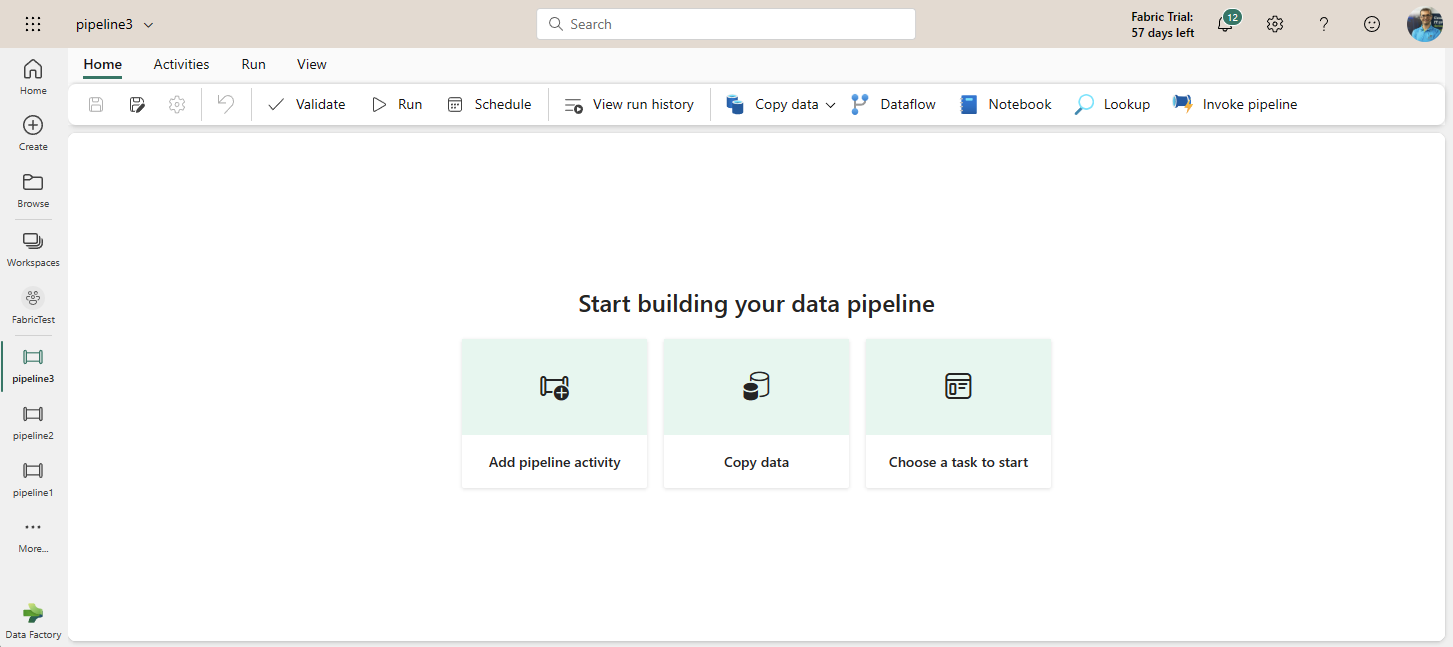
A Data Pipeline can contain multiple activities. Each activity performs an action. For example, there are activities such as Copy data or Dataflow. Here are some of these activities;

Let’s assume we want to build the scenario below in this example;
- get the date and time of the system and write it into a variable
- run a Dataflow
- after successful execution of the dataflow, get the date and time of the system and write into another variable
- send an email with a custom message including the start and end time of the execution.
The above flow is not complicated, which is why it would be a good simple example to start with the Data Pipelines.
Start by adding a Set variable Activity to the Data Pipeline. In the Settings of this activity, create a new variable, and name it StartTime with the Data Type of String. In the Value, write @utcnow.
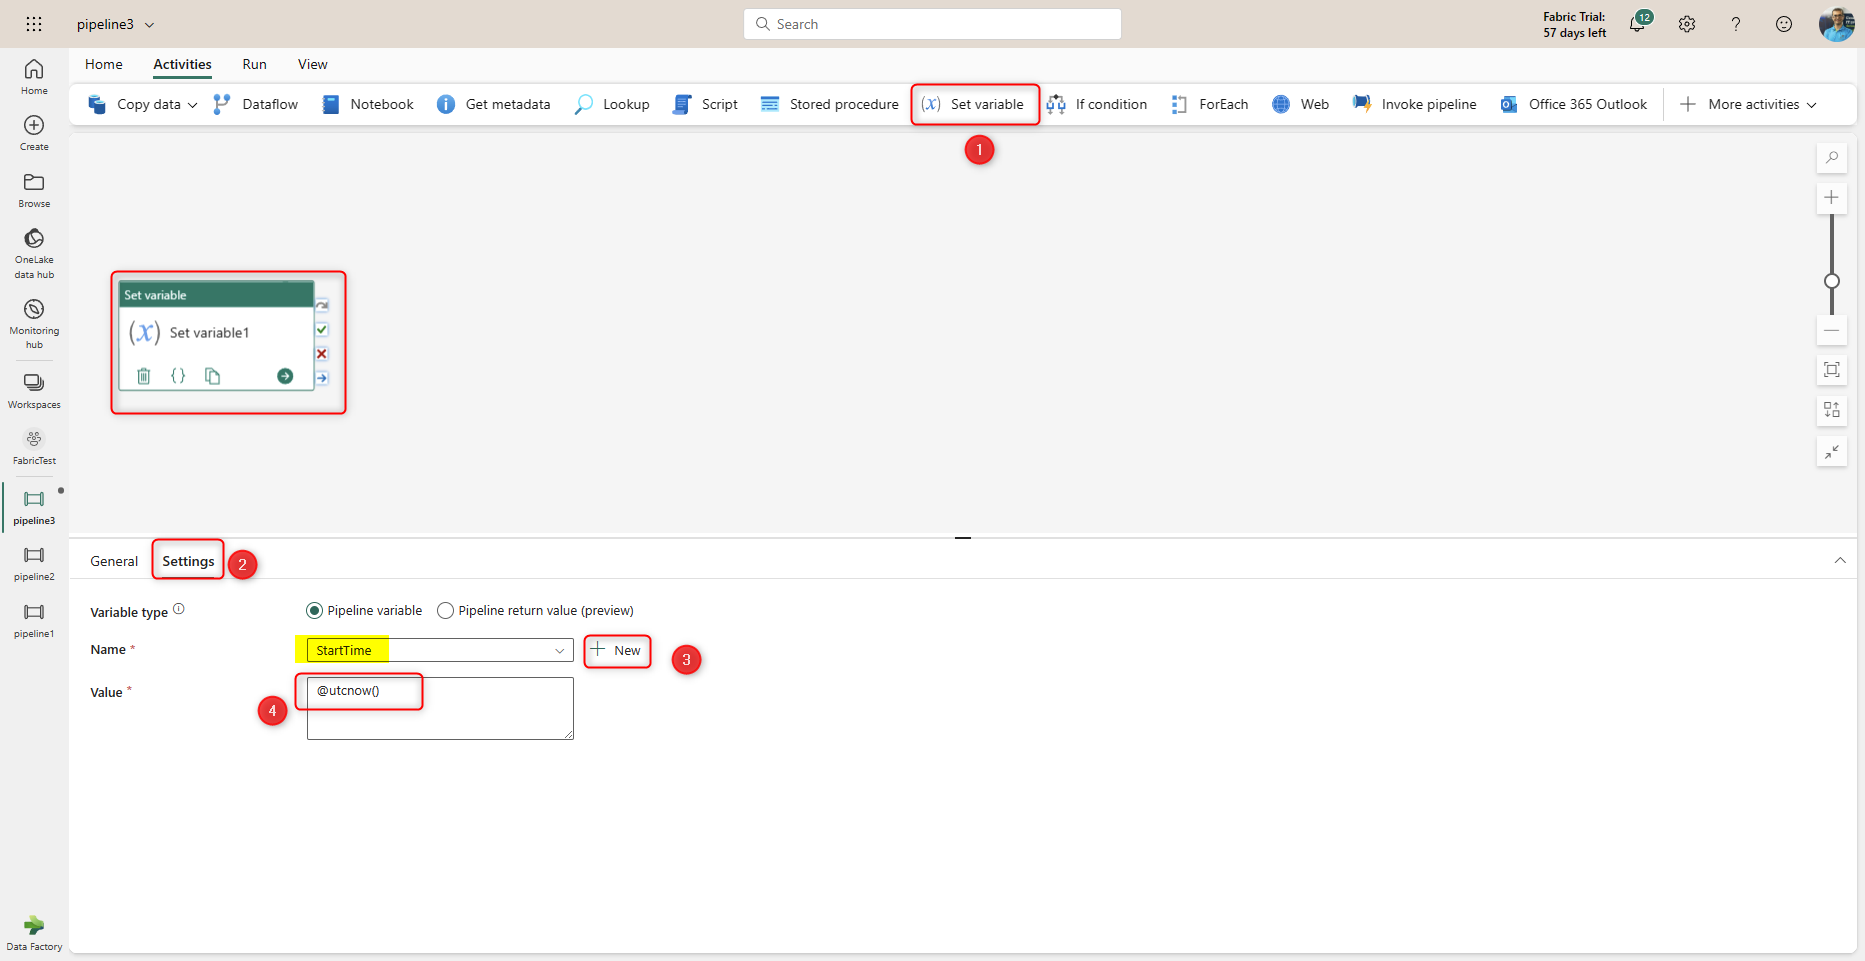
This means the date and time of running thing activity will be stored in a text variable named StartTime.
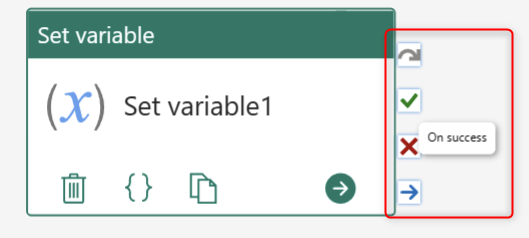
For each Activity, you can create four next steps after that; On skip, On success, On fail, and On completion. Following these four outputs is how you can build the full control flow in the Data Pipeline.
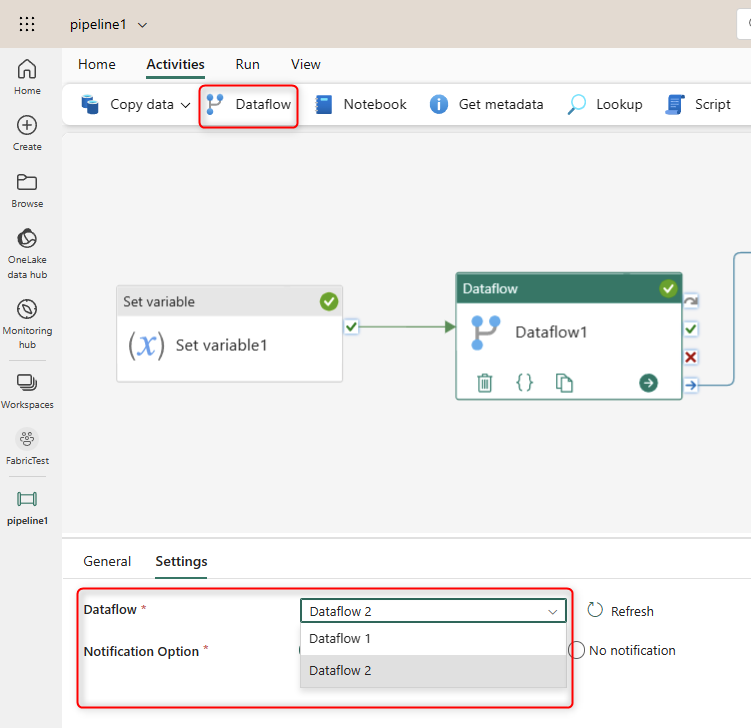
For the next Activity, we will add a Dataflow activity and set the Dataflow of that to an existing Dataflow Gen2. If you don’t have a Dataflow Gen2, I have explained how to create a simple one to load data into a Lakehouse in my previous article here.
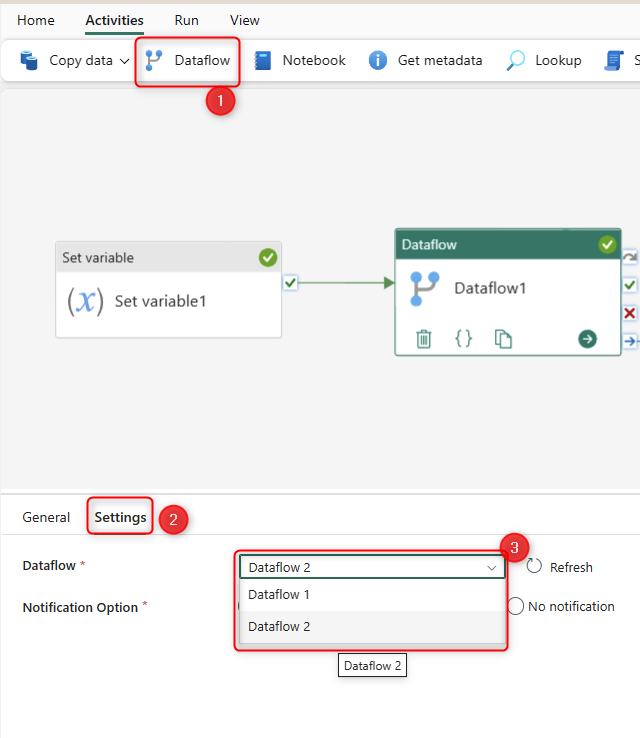
This means that at this step of the Data Pipeline, Dataflow 2 (whatever it is) will run. In my case, it is a Dataflow Gen2 that gets data from an Excel file from One Drive for Business and loads the data of that into a Lakehouse. This Dataflow might do data transformations too, and that won’t impact the behavior of the Data Pipeline.
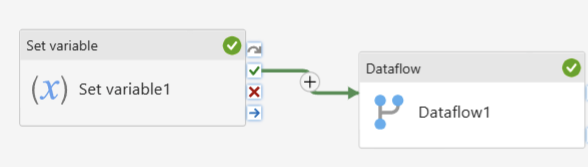
Now we can connect the On succeed output of the first activity to this by dragging and dropping from the on succeed of the “Set variable 1” activity to the “Dataflow” activity.
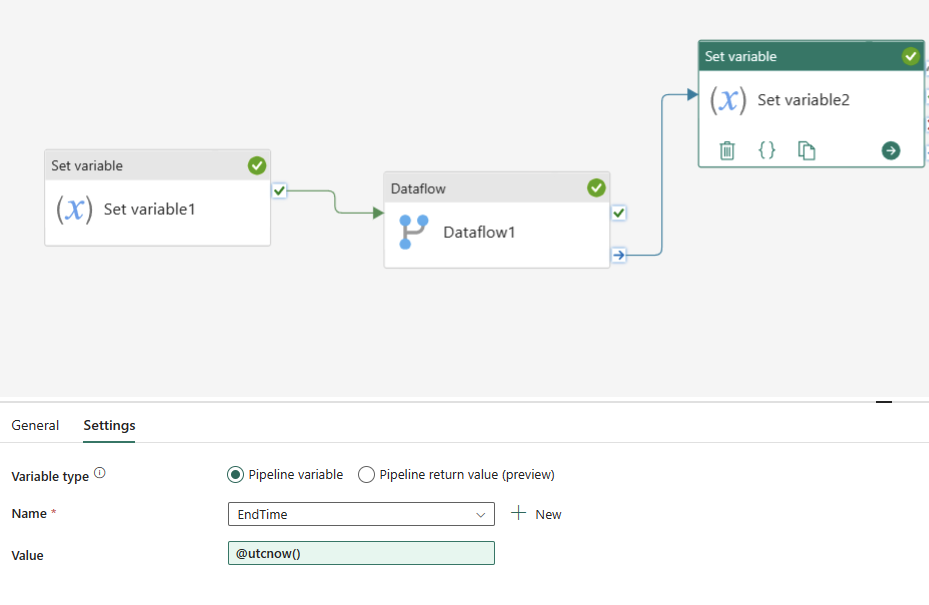
As the third activity, add another Set Variable activity, and set it to the same @utcnow value but to a new variable named EndTime.
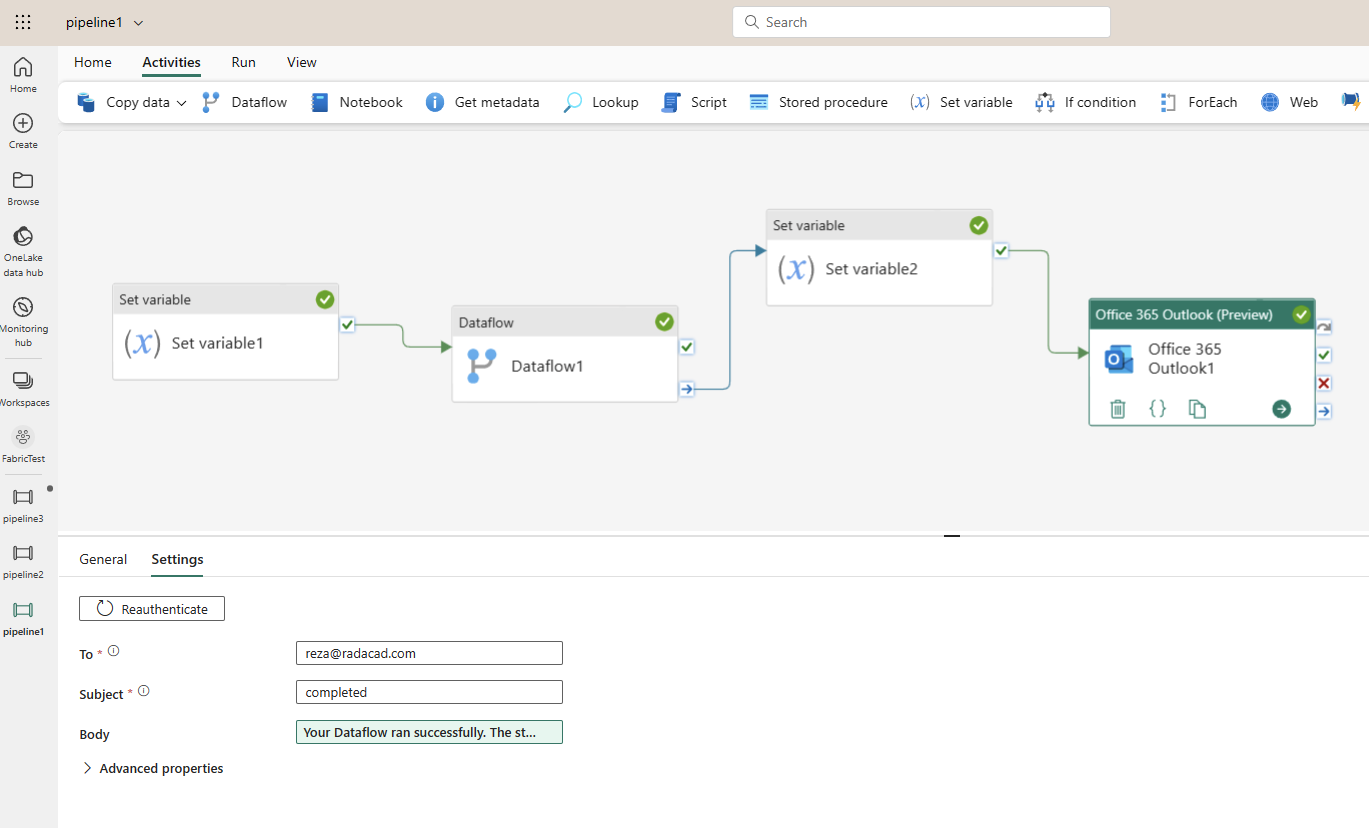
As the last activity, add an Office 365 Outlook activity, which allows you to send an email. Set the “To” and “Subject” as you want, and the body as the below;
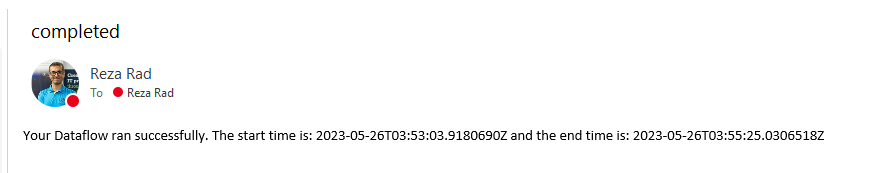
Your Dataflow ran successfully.
The start time is: @{variables('StartTime')}
and the end time is: @{variables('EndTime')}
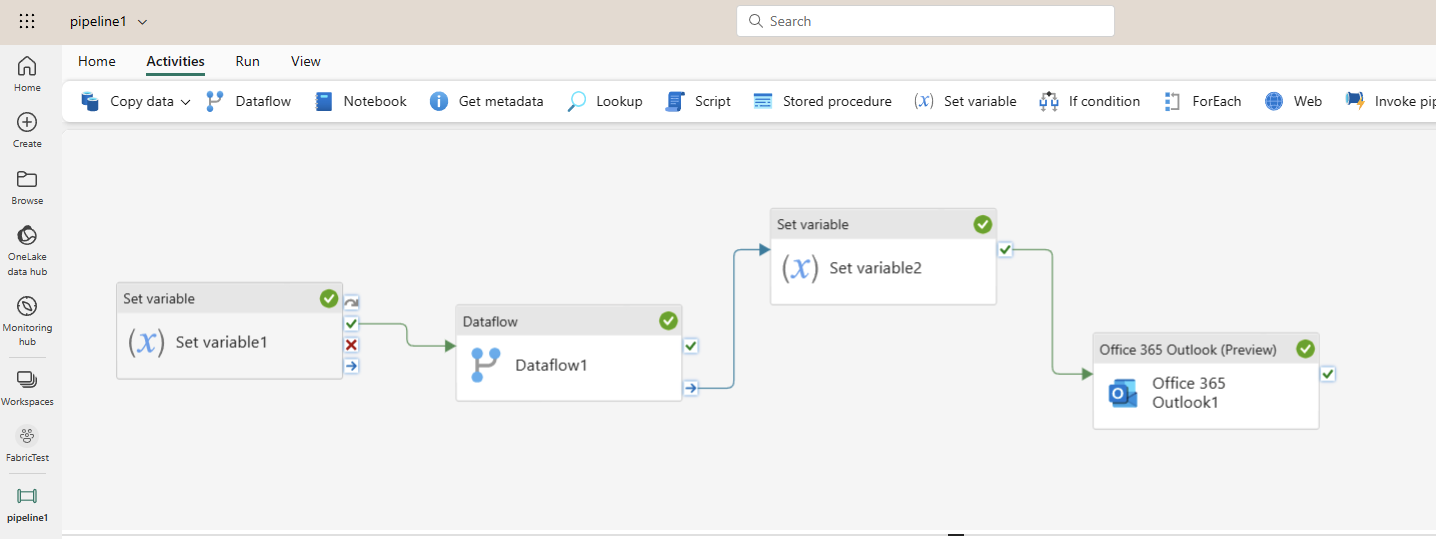
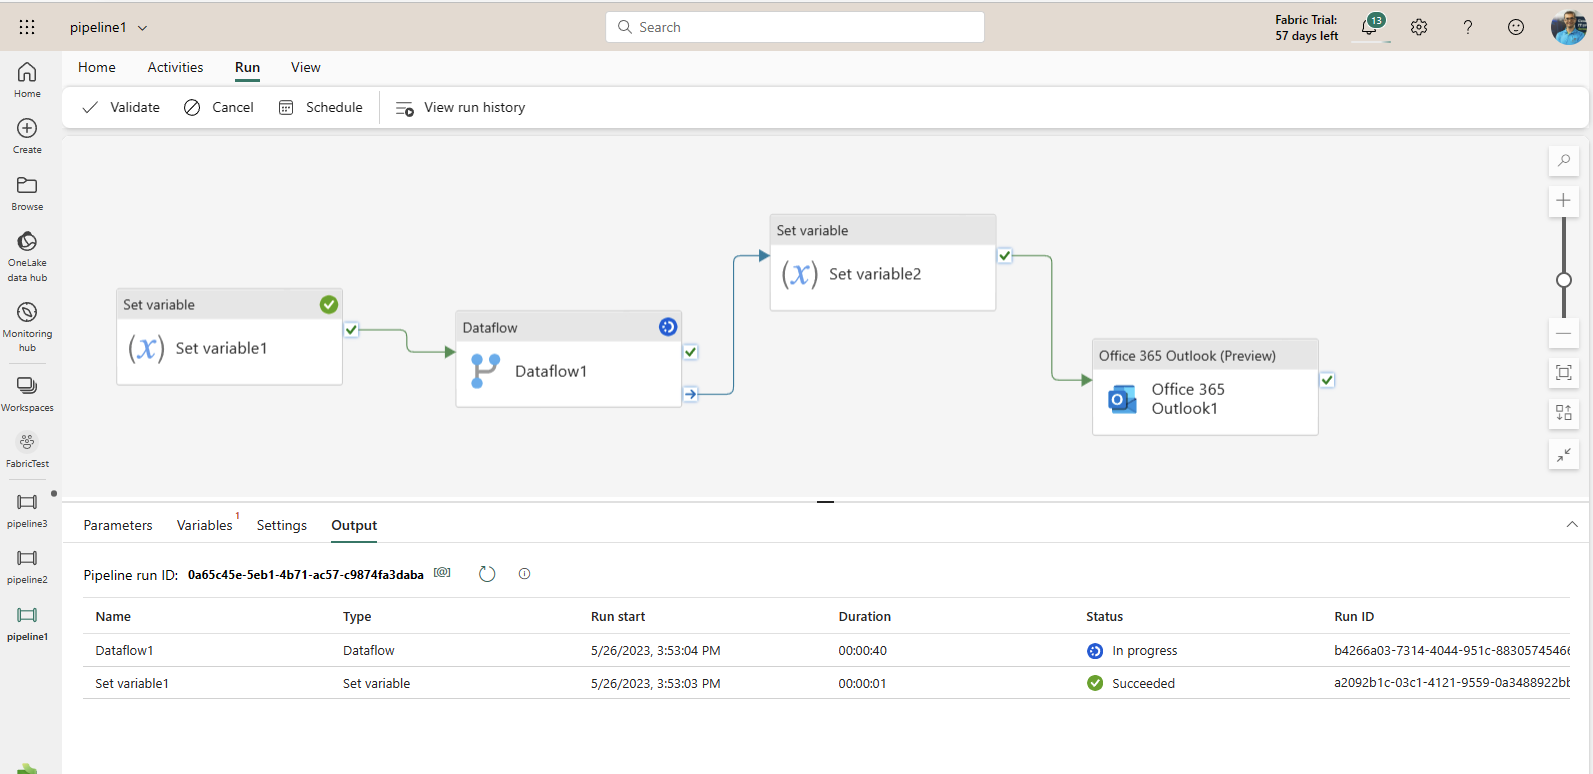
Your Data Pipeline now should look like the below;
Click on Run to execute the Data Pipeline. You will see the output window showing the status of execution.
If the Data Pipeline runs successfully, you (or the email address you entered in the Office 365 Outlook activity) will receive an email with the detail below;
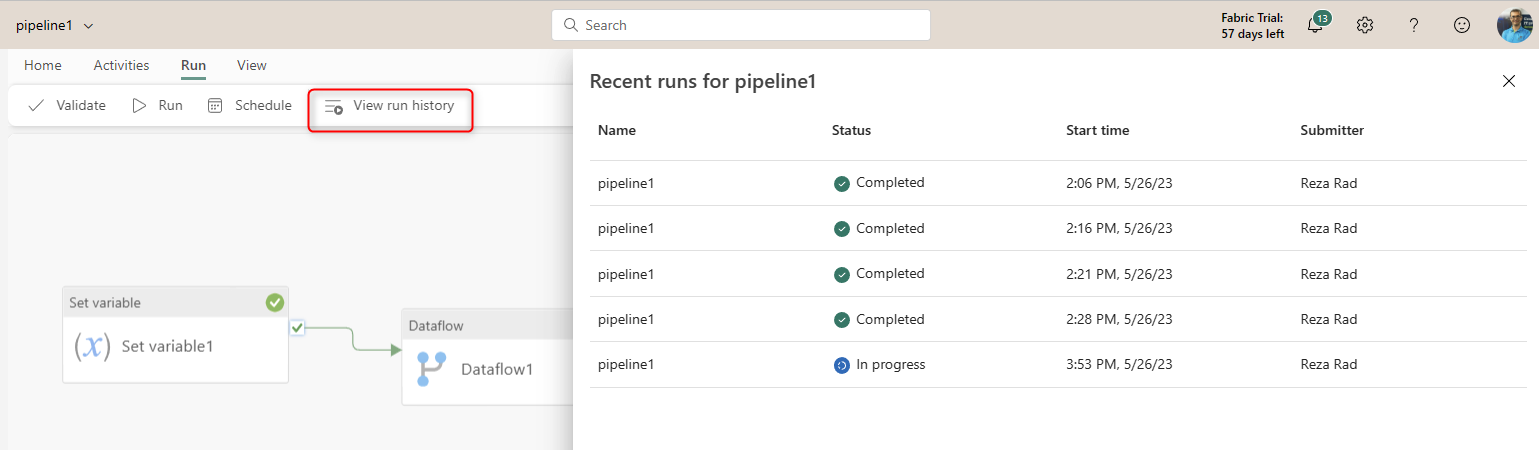
You can see the execution history of the Data Pipeline if you want.
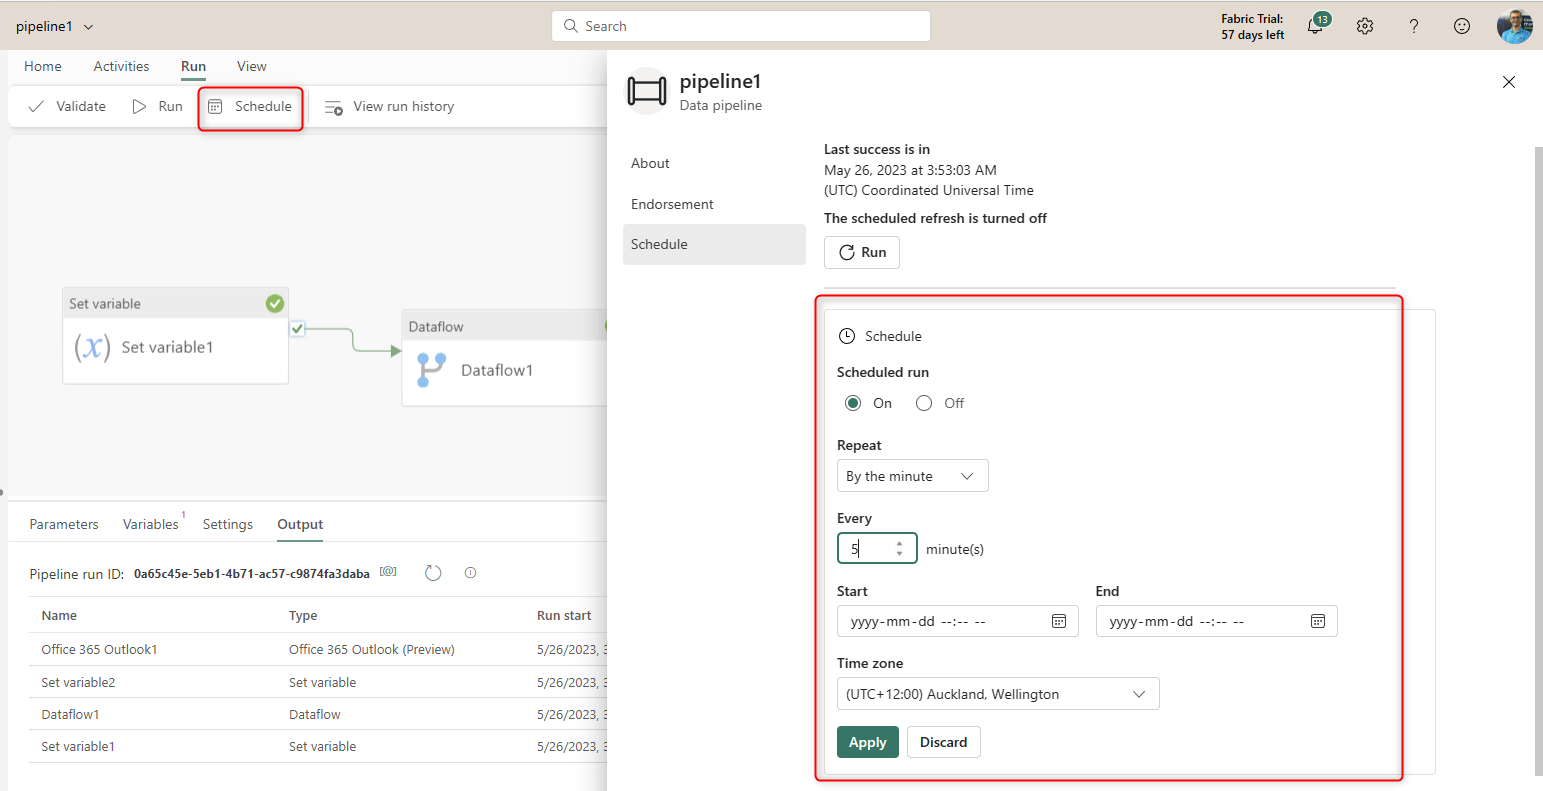
And you can schedule the Data Pipeline to run on a scheduled basis within a period.
Summary
Data Factory Pipelines, Microsoft Fabric Data Pipelines, or just Data Pipelines are complements of the Dataflow. Data Pipelines are mechanisms where you can define a control flow of execution, whereas Dataflows are for data transformations. You can run one or more Dataflows inside a Pipeline. The Pipeline can have control flow tasks such as loops, conditional execution, and data-related tasks such as executing stored procedures and copying data. Data Pipelines can be scheduled, and you can monitor their execution in the Microsoft Fabric portal.
Data Pipeline is not a subject you can learn in one article or two. There are many activities to learn, and you can learn much more about the expression language used in it (the one we used to concatenate variables to a text in the sample of this article). We will have more articles on this subject in the future.
Related learnings
If you are new to Microsoft Fabric and Dataflows, I suggest reading the articles below;
- What is Microsoft Fabric
- How to enable Fabric in your organization
- What is Lakehouse, and a sample Dataflow Gen2 created to load data into it.


Reza is author of more than 14 books on Microsoft Business Intelligence, most of these books are published under Power BI category. Among these are books such as Power BI DAX Simplified, Pro Power BI Architecture, Power BI from Rookie to Rock Star, Power Query books series, Row-Level Security in Power BI and etc.
He is an International Speaker in Microsoft Ignite, Microsoft Business Applications Summit, Data Insight Summit, PASS Summit, SQL Saturday and SQL user groups. And He is a Microsoft Certified Trainer.
Reza’s passion is to help you find the best data solution, he is Data enthusiast.
His articles on different aspects of technologies, especially on MS BI, can be found on his blog: https://radacad.com/blog.