
One of the objects in the Microsoft Fabric is the Notebook. If you haven’t worked with Azure Notebooks before, you might ask yourself; what is Notebook? Why should I use it? These are questions that we will answer in this article.
Video
What is Microsoft Fabric
Microsoft Fabric is an end-to-end Data Analytics platform software-as-a-service from Microsoft. This platform uses multiple workloads to carry all services related to data analytics, such as data integration, storage, data warehousing, data engineering, Business intelligence, Data science, etc.
These are good starting points if you want to get yourself more familiar with Microsoft Fabric;
What is Notebook?
In Fabric, there are tools for different personas of the users to work with. For example, for a citizen data analyst, Dataflows and Power BI Datasets are the tools with which the analyst can build the data model. For Data Engineers and Scientists, one of the tools is Notebook.
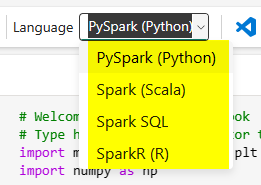
The Notebook is a place to write and run codes in languages such as; PySpark (Python), Spark (Scala), Spark SQL, and SparkR (R). These languages are usually familiar languages for data engineers and data scientists. The Notebook provides an editor to write code in these languages, run it in the same place, and see the results. Consider this as the coding tool for the data engineer and scientist.
The output of Notebook codes is highly dependent on the code itself. Sometimes you may write a code that generates a histogram chart. In that case, the Notebook visualizes the output as a histogram. Sometimes, you might write code that doesn’t generate a visual output; it might be code that loads data into a table. In cases like this, Notebook runs the code and loads the data into the table but won’t visualize anything.
In a simple and short definition, Fabric Notebook is a place to write and run codes for data engineers and data scientists.
The code written in the Notebook can use objects within the Fabric workspace, such as Lakehouse, etc. For example, you can write a code that loads data into a Lakehouse or query data from it.
At the time of writing this article, there are only four languages supported by Fabric Notebooks;
- PySpark (Python)
- Spark (Scala)
- Spark SQL
- SparkR (R)
Explanation of the four languages is a big topic and is outside of the subject of this article. However, we can look at an elementary example of using a Notebook in the following section.
What can I do with the Notebook?
You can do anything if supported by one of the four programming languages mentioned above. For example, here are some of the things you can do;
- Load data into tables or files of the Lakehouse.
- Analyze the data using some charts and functions.
- Run predictions and machine learning algorithms on the data.
- Explore the data with querying and running functions.
- …
Getting Started with Notebooks
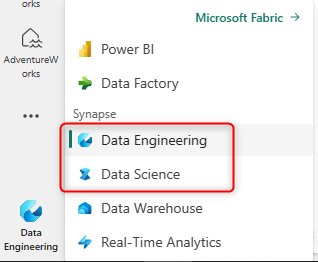
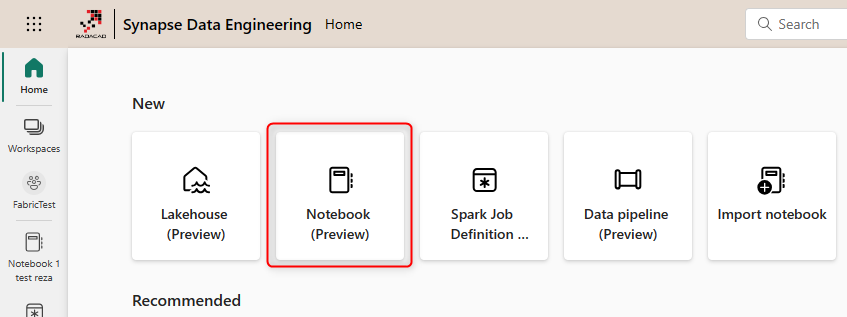
The Notebook is one of the Fabric objects. You have to be in a workspace that has a Fabric capacity, and then you can go under either Data Engineering or Data Science workloads to access the Notebook;
Create a Notebook.
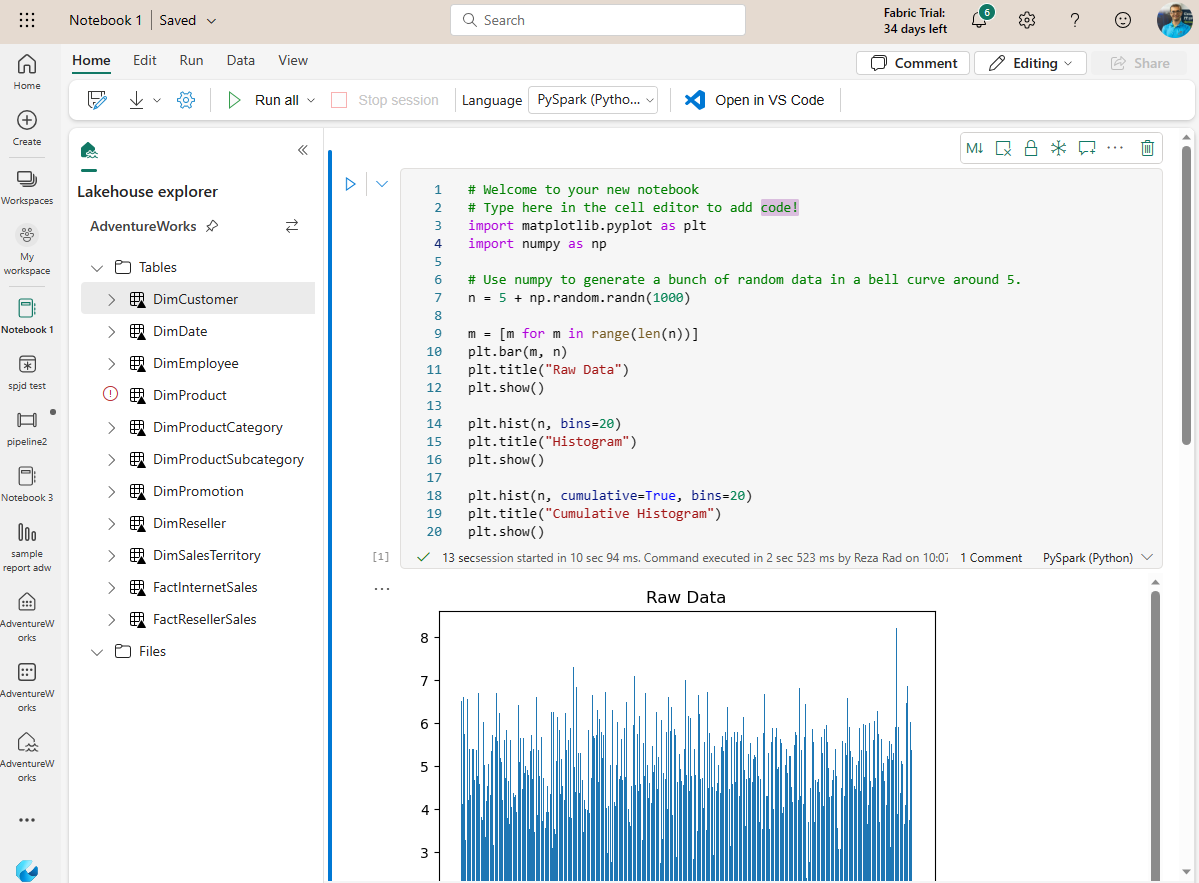
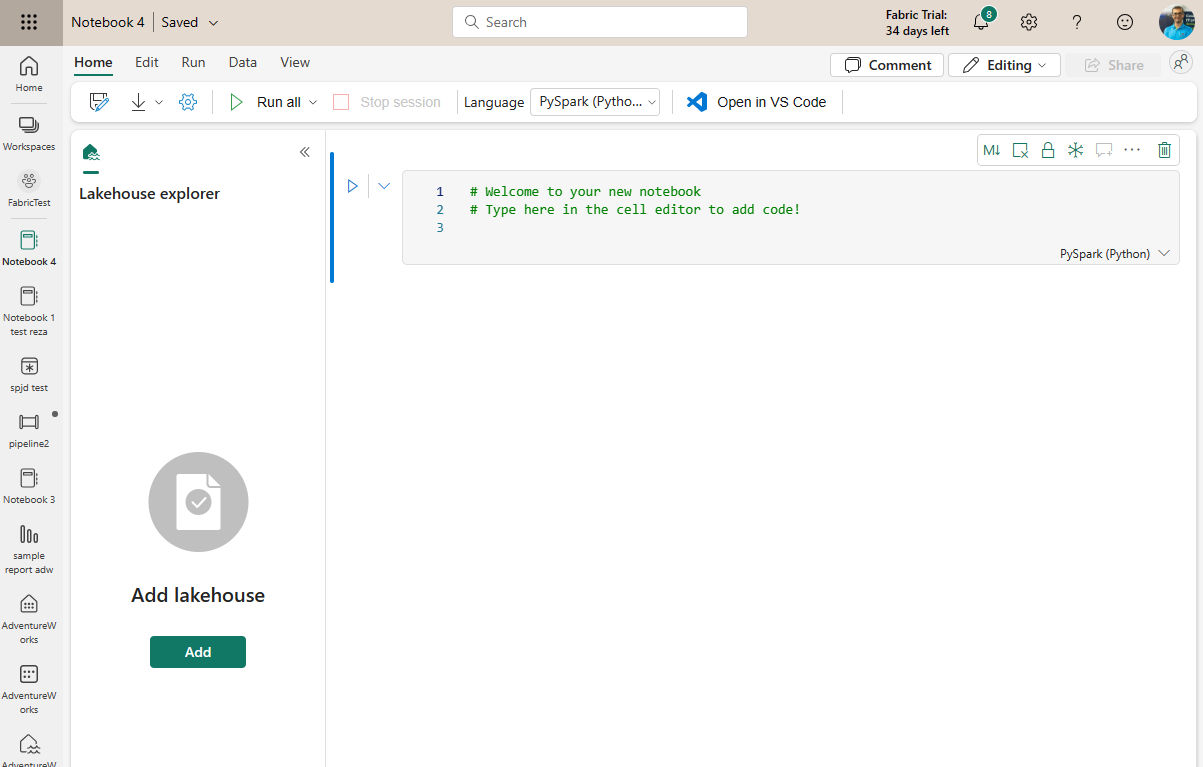
The Notebook’s environment is straightforward. It has an editor with blocks where you can write codes in it. Plus a Lakehouse explorer on the left.
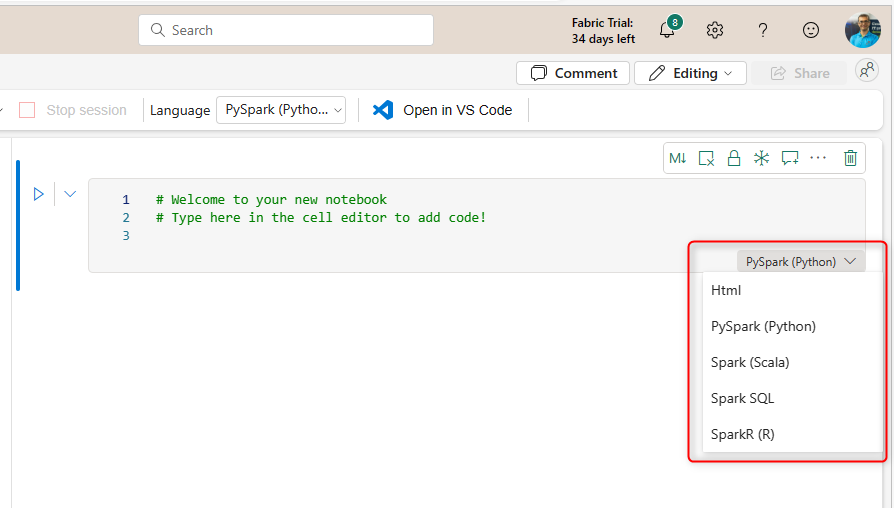
A Notebook can have one or more cells of code (or you can call it a block of code). Each cell can use a different language. You can choose the language for the cell using the language dropdown.
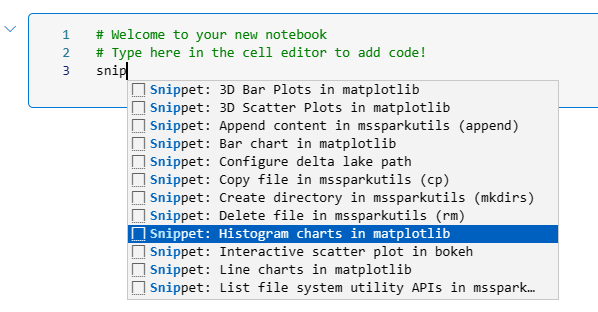
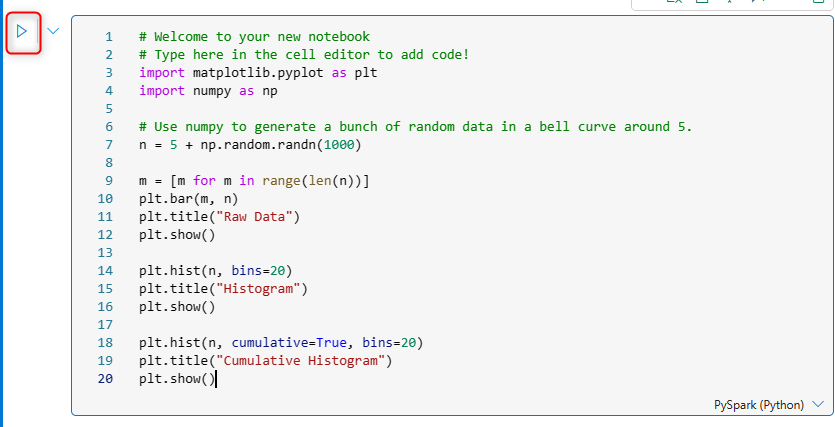
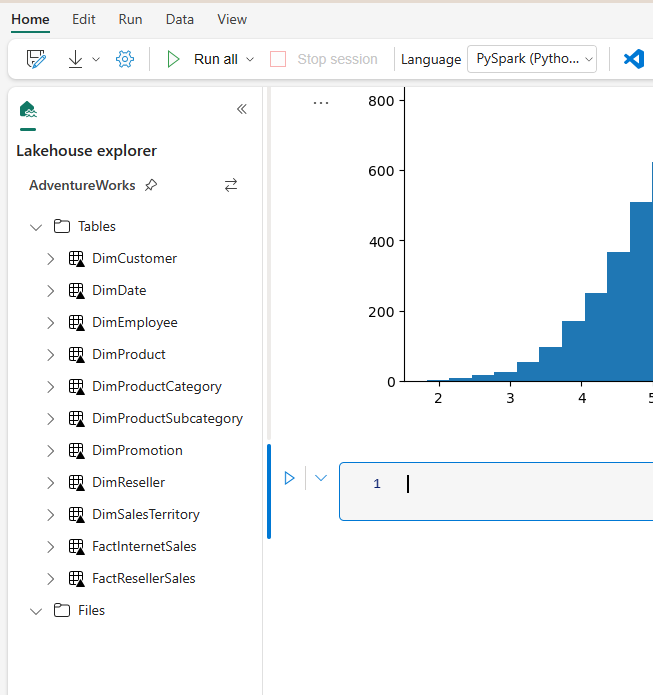
Inside the cell editor, you can type the code. You can also use some code snippets. A code snippet is a small block of reusable code (like a template). For example, I can use the code snippet below to create a histogram from a sample dataset. To use a snippet, start typing it in the cell editor.
The code generated using the snippet above is;
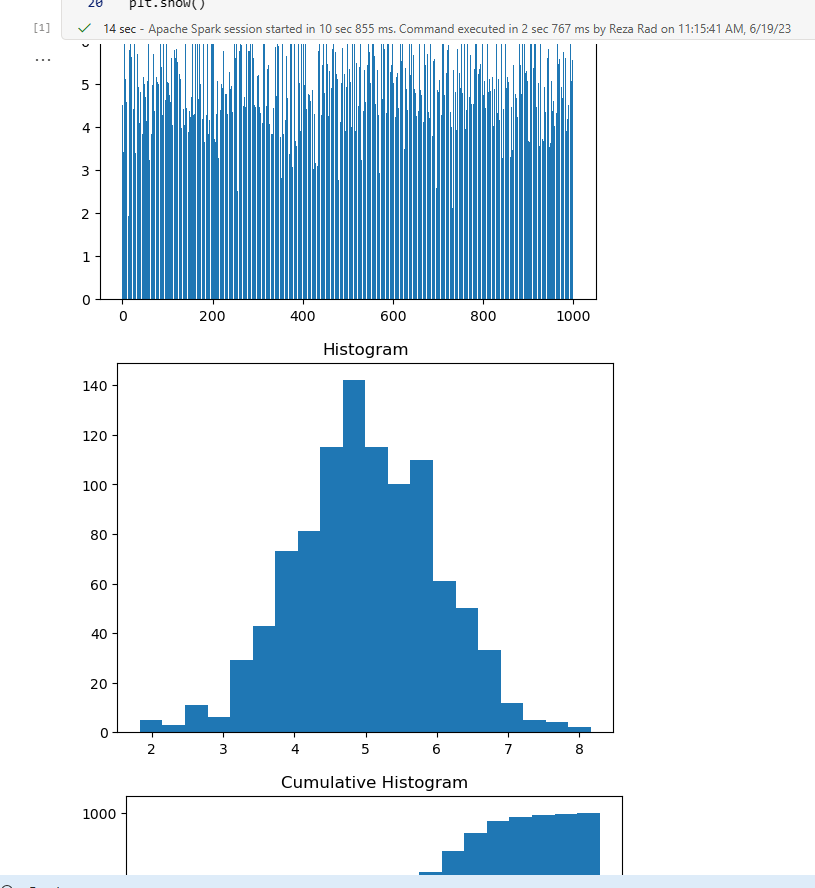
You can run the code in the cell using the run button beside the cell. In this case, because the code generates a visual output, the output would appear in the Notebook as below;
The Notebook (at the time of writing this article) supports the Lakehouse connection in the editor. You can add the Lakehouse connection here. Read my article here to learn what the Lakehouse is and how to create it.
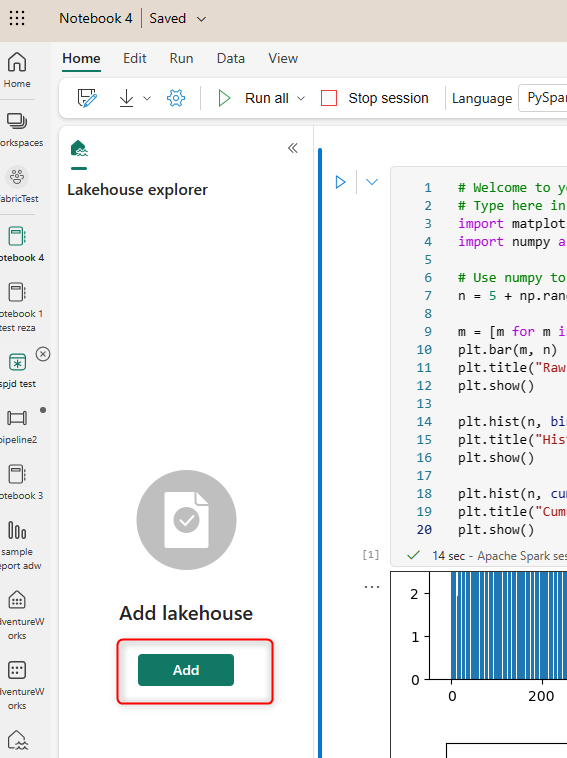
This enables you to connect to an existing Lakehouse or create a new one.
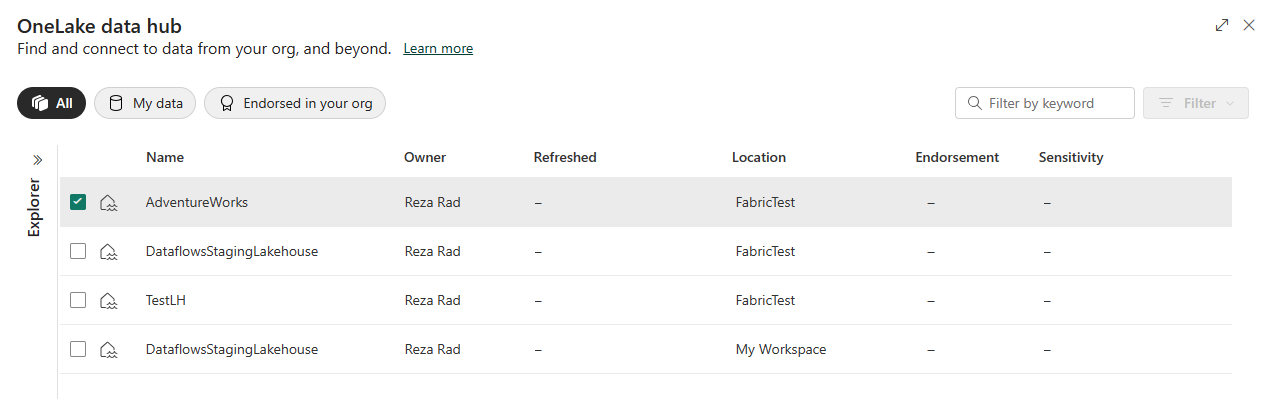
Then the Lakehouse Explorer will be available on the left-hand side of the Notebook editor.
You can even drag and drop the tables into a cell so that it generates the query code for that table in the specific language of that cell.
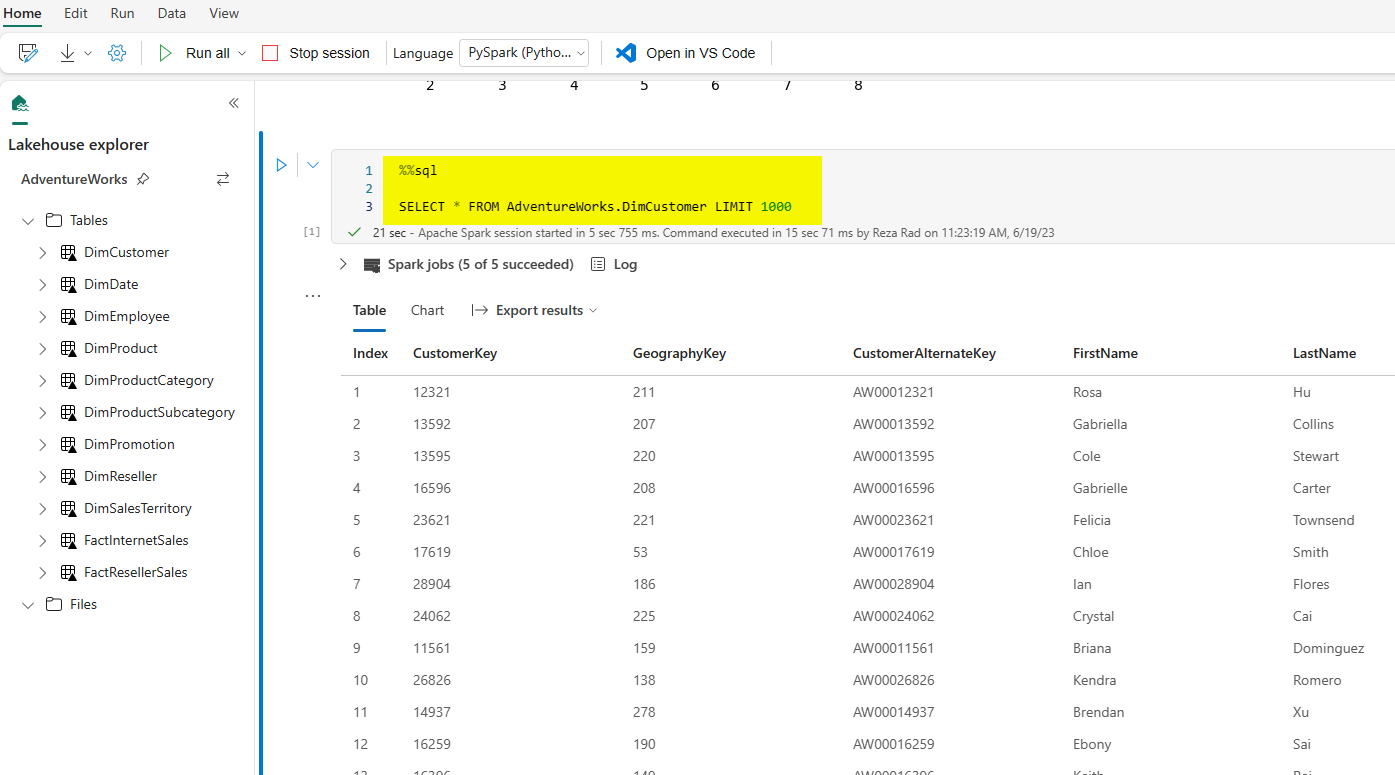
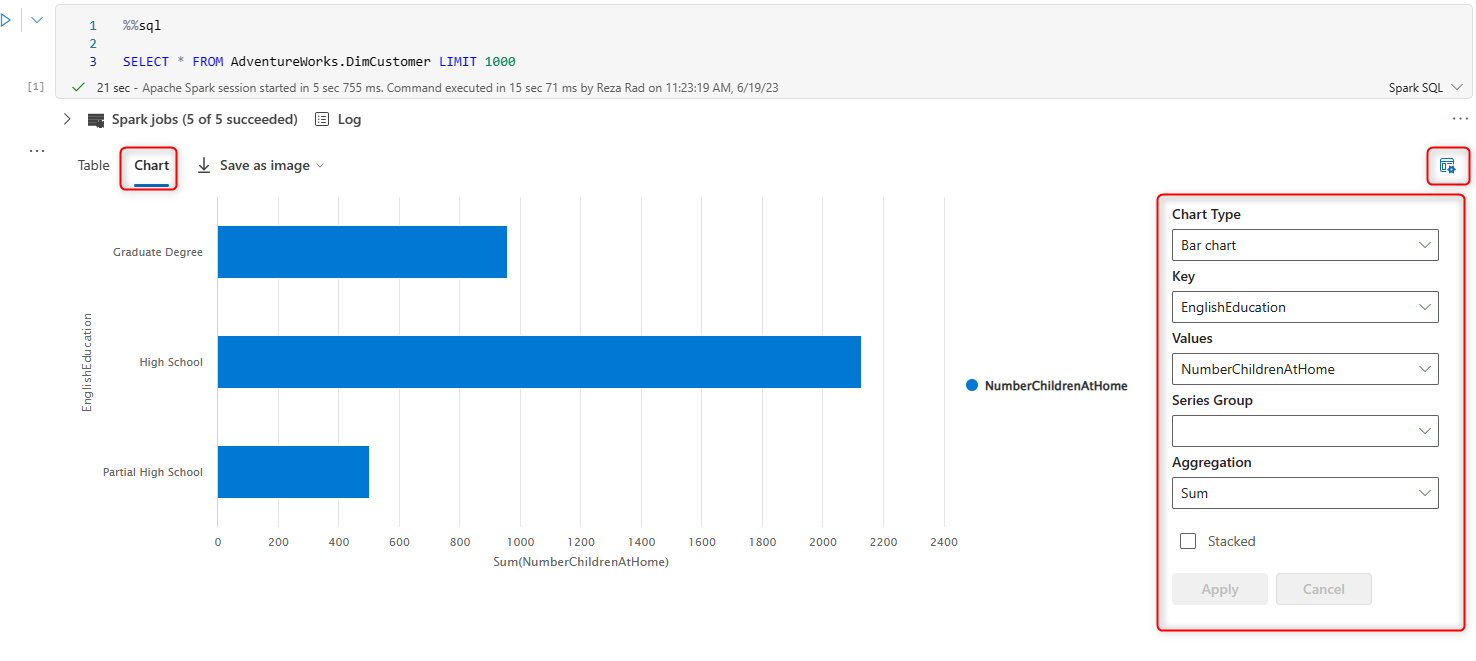
When you have a data table output, you can use some of the Notebook features to analyze that data easier. For example, you can view the data as a chart. You can also use the setting button to choose what field to use for each chart axis or even change the chart type.
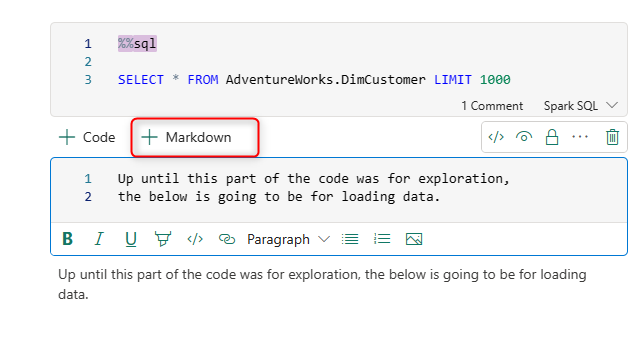
The Notebook also provides a place for you to collaborate with other developers using comments.
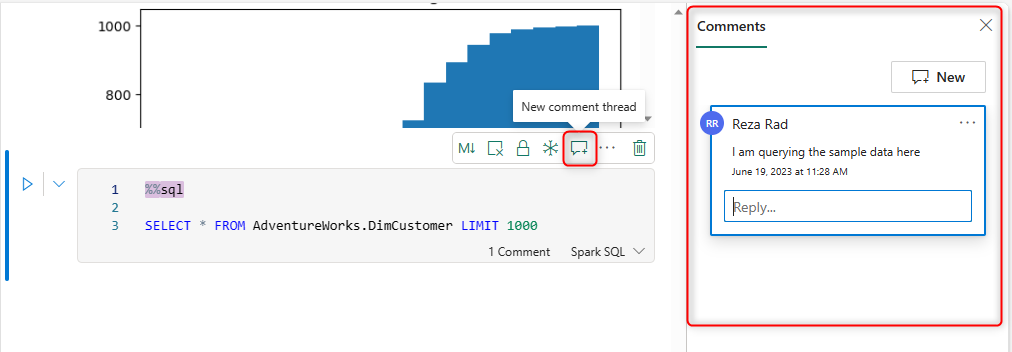
You can also add inline comments using the # keyword in the cell or create a Markdown cell.
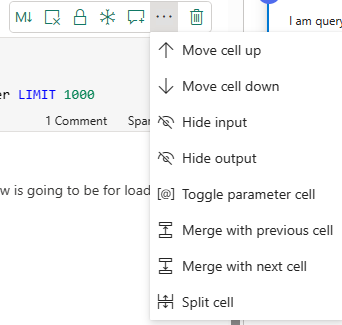
You can do a few other actions on each cell, such as locking or unlocking it, splitting or merging it with other cells, clearing the results, etc.
In short, The Notebook provides the necessary tool for a data engineer or scientist to do their job using this simple-to-use and powerful editor, which supports four languages.
You may say, “Well, this is nothing powerful; it is just a place to write some codes!”. But believe me; this is everything for someone who knows the language for that coding. This is like giving a C# code compiler to a C# programmer. This means that a C# programmer can do anything he or she wants if supported in the language. The Notebook editor might not have some fancy looks, such as Dataflow UI or Visual Studio Enterprise, for simplifying the work, but it is powerful nevertheless.
In some ways, I think the Notebook is even more powerful than a programing language compiler. Here you can work with four languages. Four languages each have powerful features. You can use Spark SQL to query the data while using PySpark (Python) to run machine learning algorithms, etc.
Backup and Restore
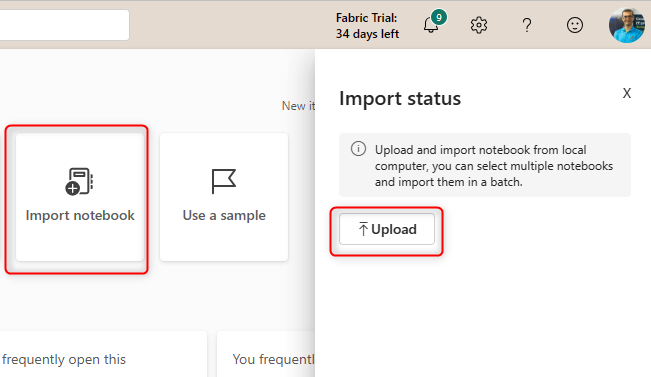
Although the Notebook is saved in the workspace, It is easy to export the Notebook as a file.
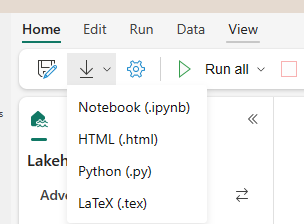
The exported files can be used to be imported into a new Notebook.
Scheduling and Automating
When the code is written, if it needs to be scheduled and automated, there are a couple of options.
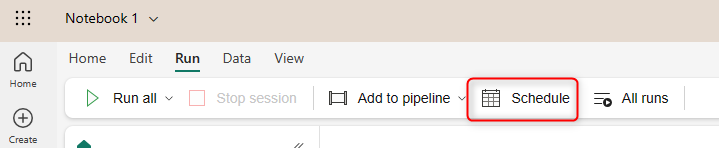
The Notebook itself can be scheduled. You can use the Schedule button under the Run menu.
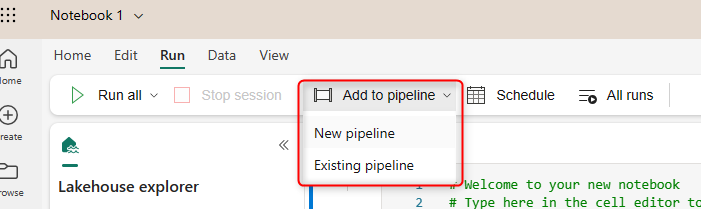
Alternatively, you can add the Notebook to a Pipeline for a more comprehensive solution. I have explained the Data Pipelines here. You can add it to the Data Pipeline directly from the Notebook editor.
Or, if you are in the Data Pipeline editor, you can add a Notebook activity and select the Notebook in the settings of it.
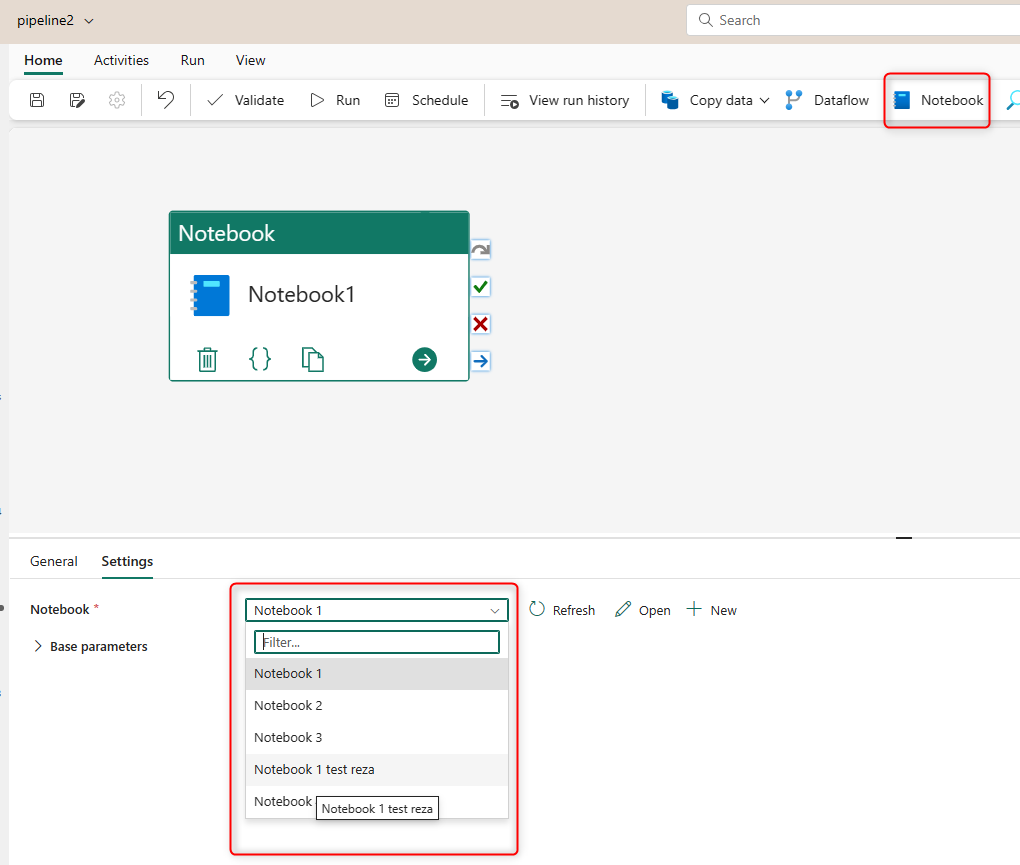
Adding the Notebook as an activity inside the Pipeline can make the Notebook part of the ETL process alongside with execution of Dataflows and many other tasks and activities.
Summary
In summary, Notebooks are a place to write and run codes in multiple languages inside the Microsoft Fabric environment. The supported languages are familiar to data engineers and scientists. This makes the Notebook an essential tool for them. The Notebook has some simple-to-use editor functionalities for collaboration and coding. The Notebook can then be integrated with other Fabric objects, such as Lakehouse and Data Pipeline, to create an end-to-end data analytics solution using Microsoft Fabric.


Thanks Reza , for the wonderful explanation