
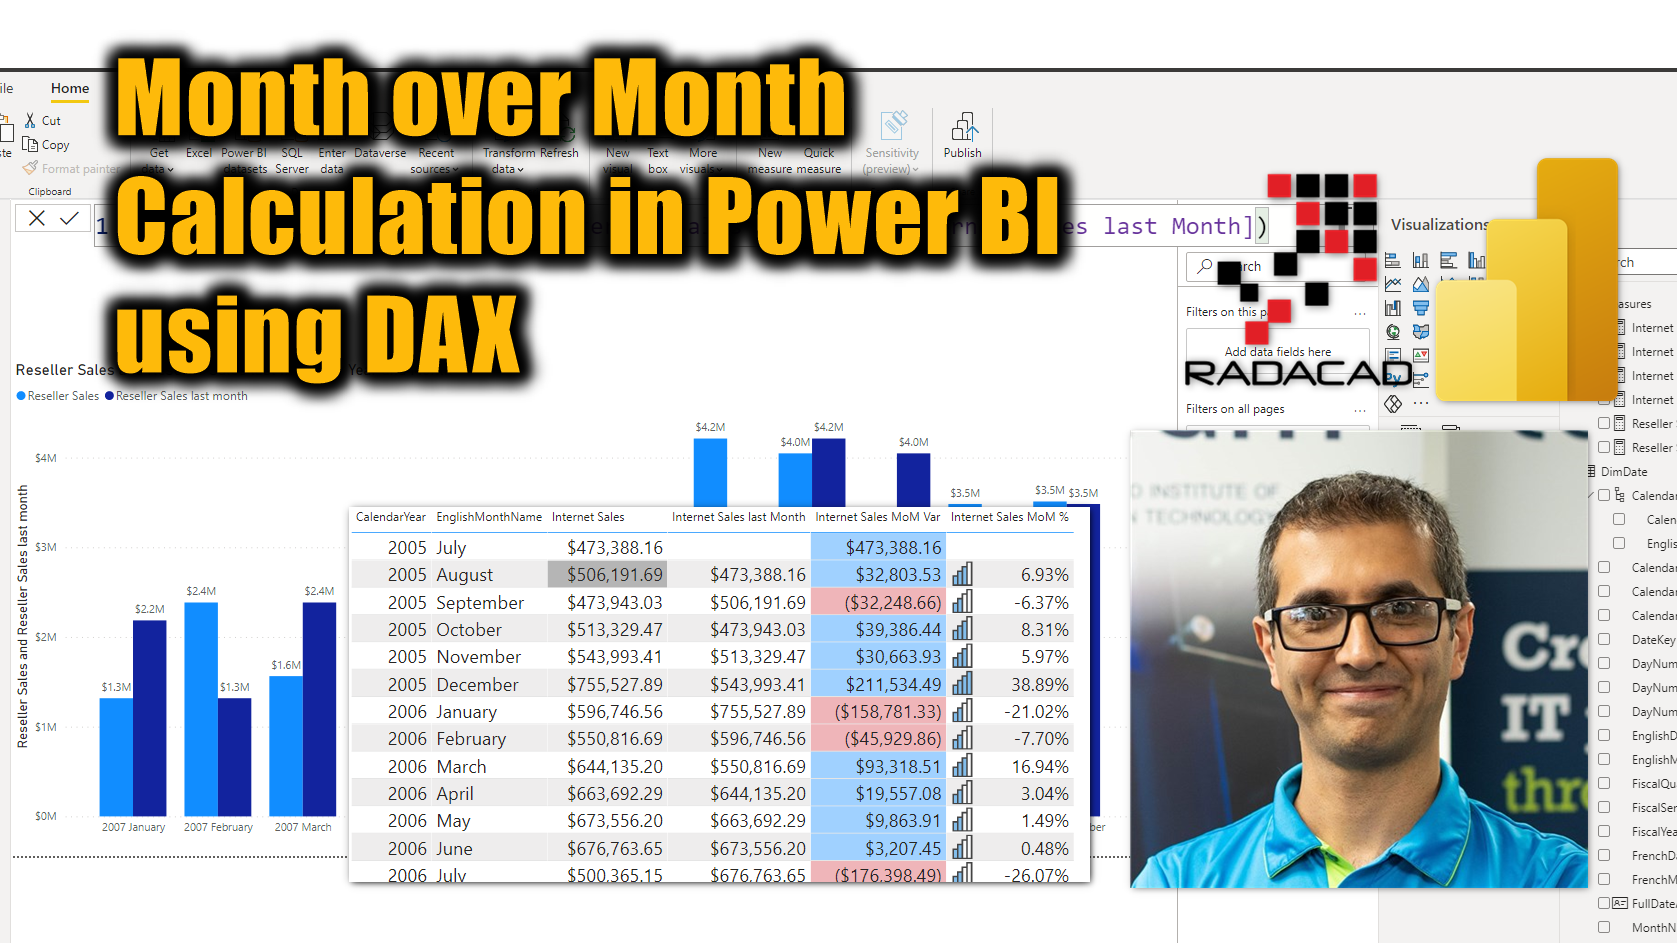
When working with dates, one of the common types of analysis is period vs period, such as Year over year, and Month over month. In this article and video, I’ll explain how you can use DAX to write calculations for month-over-month simply in any Power BI report.
Video
What is a month-over-month calculation?
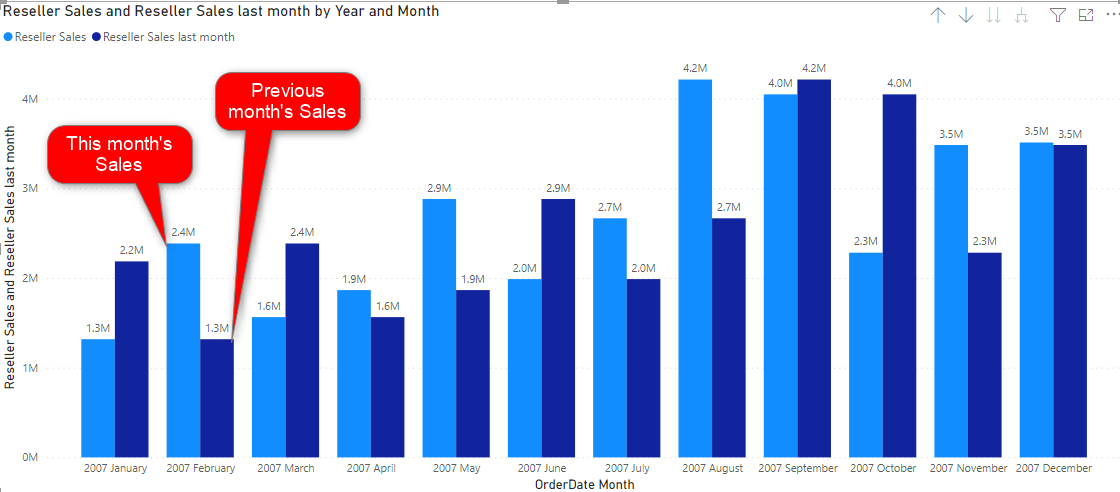
Month over month, means comparing the value of each month with the value of the month before. An example is below;
This calculation can be done using many different ways in Power BI, most of them using DAX. You can use different functions to achieve the result. I am just showing one of the ways using ParallelPeriod function.
ParallelPeriod function in DAX
ParallelPeriod is a tabular function, that returns a table of dates that is parallel period to the current period. You can select what the period should be (internal) and the number of it back or forth. Here is how the function can be used;
PARALLELPERIOD(<dates>,<number_of_intervals>,<interval>)
Here are how parameters work;
- dates: the Date column that slices and dices the visual
- number_of_intervals: How many periods you want to go back (negative number) or forward (positive number)
- interval: the period
This function returns a table of dates, and cannot be used directly in a measure, you can wrap it in other functions to return a scalar value for a measure.
The date field is the most important parameter here. This should be the date field from the date table, which can be the date field in either a custom date table or the default date table of Power BI. Let’s look at them one by one.
Default date table sample of Sales last month
If you have a date field in your table, and you have not turned off the auto-date/time in Power BI, that most probably means you have a built-in default date table created by Power BI, which you can use the field from it to calculate the sales last month like below;
Reseller Sales last month =
CALCULATE(
    [Reseller Sales],
    PARALLELPERIOD(
        FactResellerSales[OrderDate].[Date],
        -1,
        MONTH)
)
The [OrderDate].[Date] is representative of the date field in the default date table. The .[Date] part of this is important because otherwise, you are not using the date field of that table. If you want to learn more about the default date table, read my article here. Here are the results of the expression above:
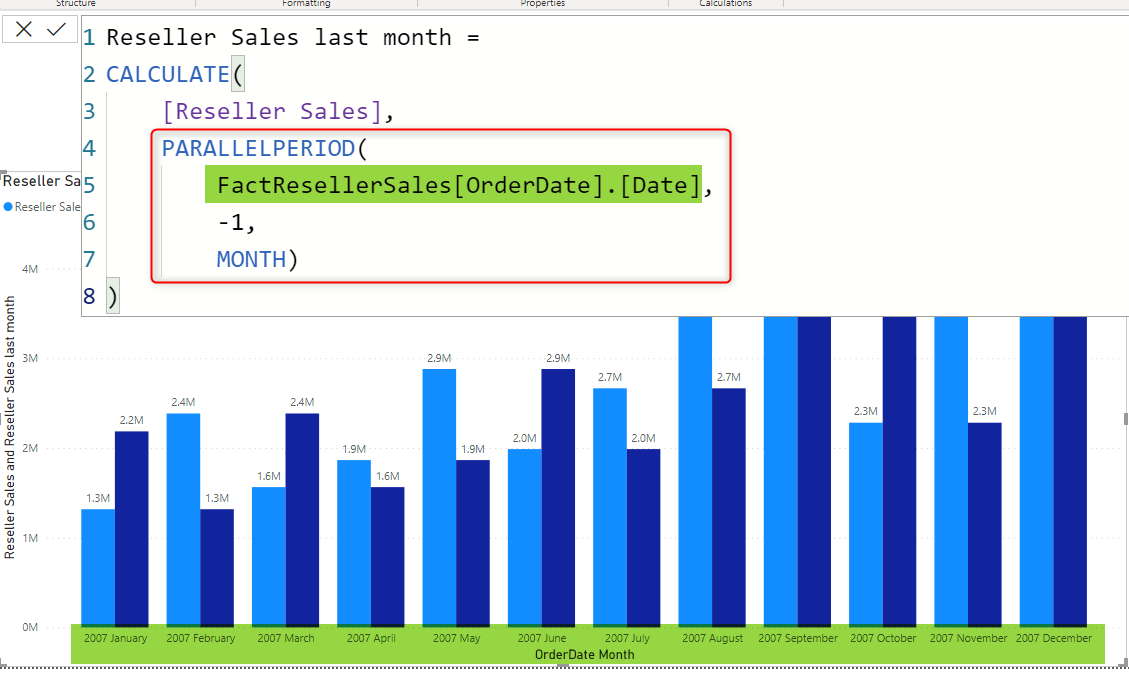
The interval is Month, which means we are getting the sales of a month. That month is previous month, because the number of intervals is -1. and the date field should be the same field used as the Axis of the visual.
Custom date table sample of Sales previous month
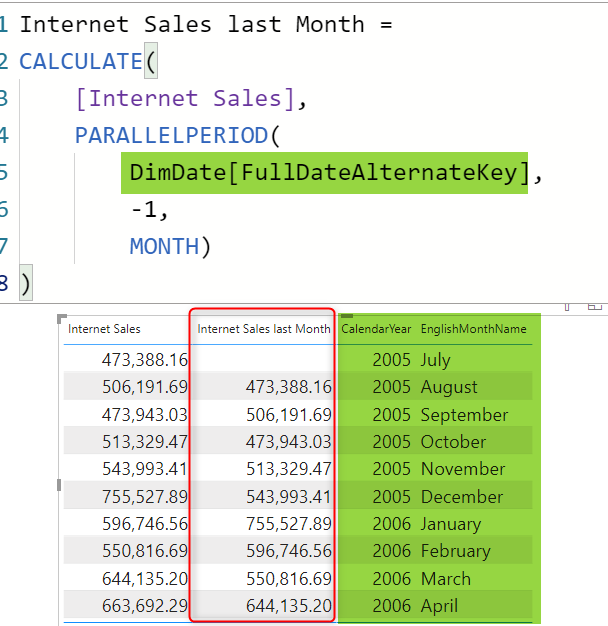
If you are using a custom date table, you have to mark it as a date table in Power BI, and then you can use the date field directly in the ParallelPeriod without the “.[Date]” part.
Internet Sales last Month =
CALCULATE(
    [Internet Sales],
    PARALLELPERIOD(
        DimDate[FullDateAlternateKey],
        -1,
        MONTH)
)
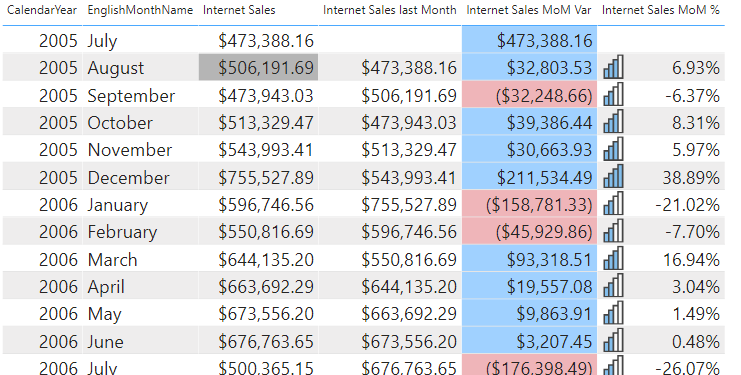
The expression above can return the same result for previous month’s calculation:
Month over Month variance
Once you got the calculation of previous month, the month over month variance is just a subtract.
Internet Sales MoM Var = [Internet Sales]-[Internet Sales last Month]
Month over Month percentage (growth or shrinking)
And the percentage would be another simple calculation like below:
Internet Sales MoM % = DIVIDE([Internet Sales MoM Var],[Internet Sales last Month])
Here is the results with some conditional formatting added;
Other intervals and periods are possible
ParallelPeriod gives you the option to change the interval to Quarter or Year too, and you can change the number of intervals to more and change it to negative and positive. There are other functions that can be used for this type of calculation, DateAdd is one of them. Read my blog here to understand the difference of ParallelPeriod and DateAdd;
Download Sample Power BI File
Download the sample Power BI report here:


Reza is author of more than 14 books on Microsoft Business Intelligence, most of these books are published under Power BI category. Among these are books such as Power BI DAX Simplified, Pro Power BI Architecture, Power BI from Rookie to Rock Star, Power Query books series, Row-Level Security in Power BI and etc.
He is an International Speaker in Microsoft Ignite, Microsoft Business Applications Summit, Data Insight Summit, PASS Summit, SQL Saturday and SQL user groups. And He is a Microsoft Certified Trainer.
Reza’s passion is to help you find the best data solution, he is Data enthusiast.
His articles on different aspects of technologies, especially on MS BI, can be found on his blog: https://radacad.com/blog.
Hi,
Thanks for the above article and it really helps a lot to figured out my scenario.
I used the parallelperiod and it calculates the correct figures when its not applied any date filters. (Full length period) But the moment I apply any date filter its not behaving correctly. Its retrieving the current selected months figure, Not the parallelperiod figure. Any help?
It might be due to the default date table behavior. can you please share a photo of your visual and the model and the DAX expression please to check in detail?