
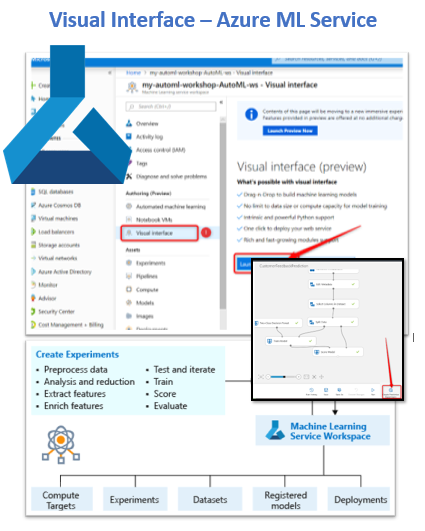
Azure ML services has been introduced for a while, however in the last Microsoft Build, the visual interface of azure ml service has been introduce that has so much similarity to Azure ML Studio.
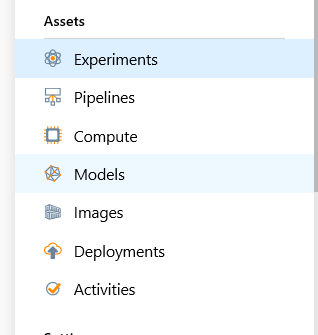
however there are some difference between them as the created experiment in visual interface be shown in the Assets section as Experiment, the virtual machine that the model is run also be shown in the Compute section, and the deployment and other part, so despite the Azure ML studio, the model and service created can be access beside other model created using Automated ML, Jupyter Notebook Python and so forth.

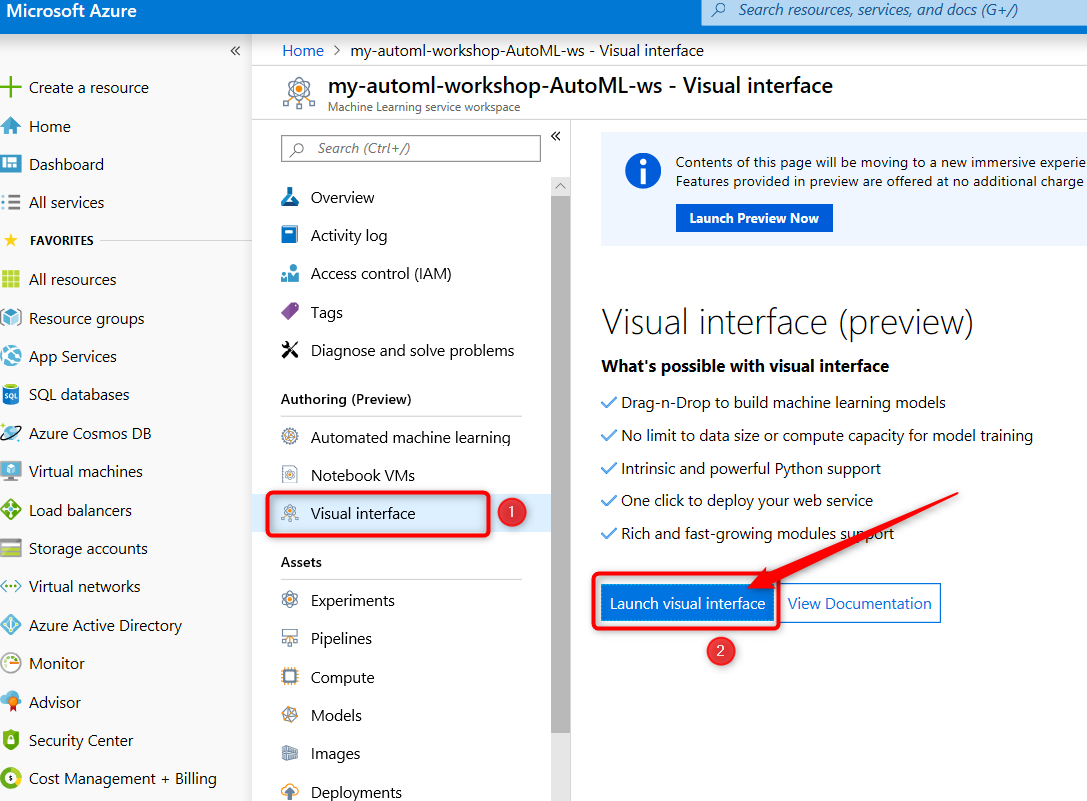
to access to Visual Interface, you need to login to Portal.azure, then in the Azure ML Workspace, choose the Visual interface
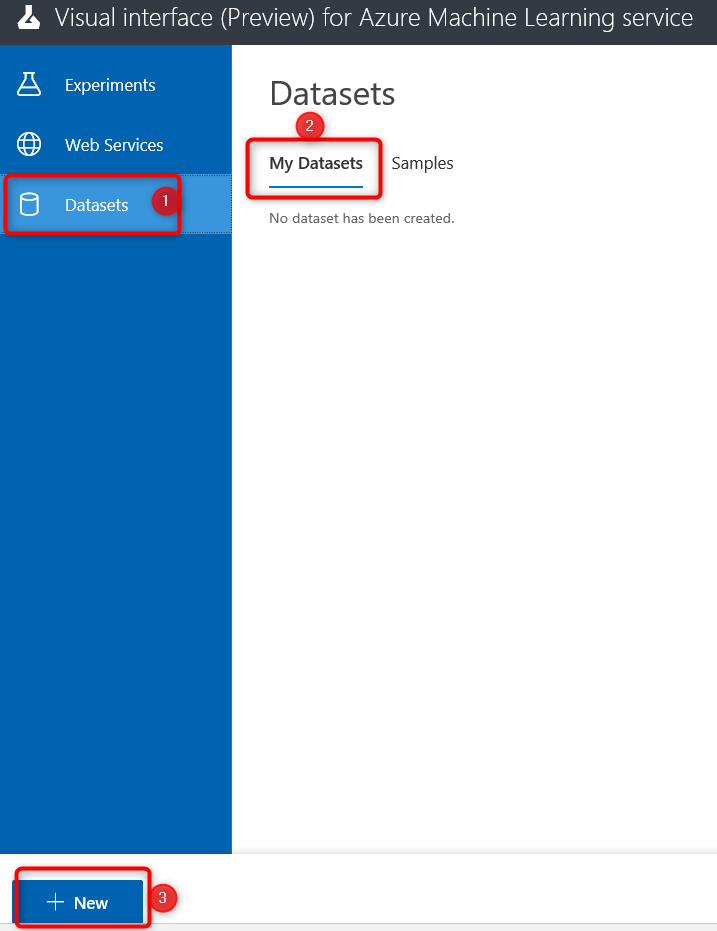
Click on the Launch Visual Interface, click on the Datasets, then My Datasets. Choose the New datasets
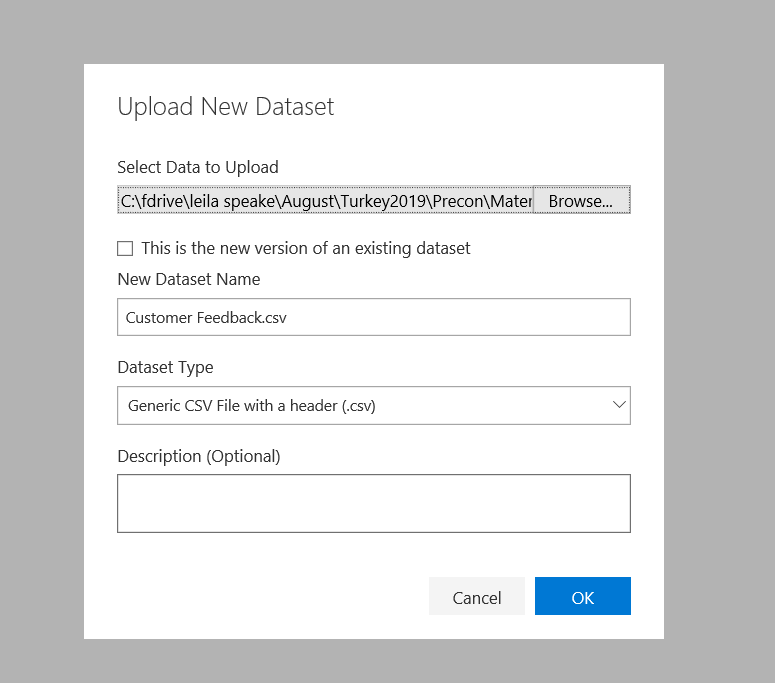
Upload data from local file, then, load the data into datasets.

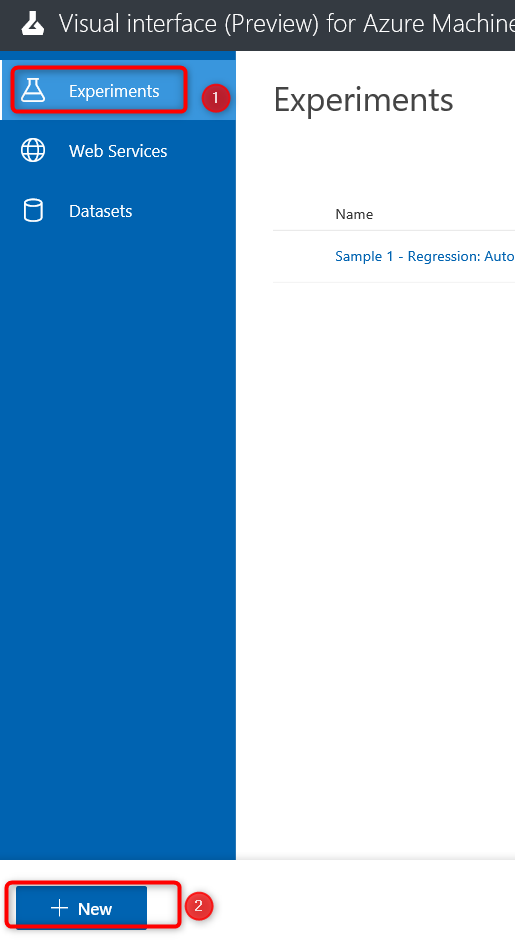
Then, click on the Experiments, and then click New experiment.
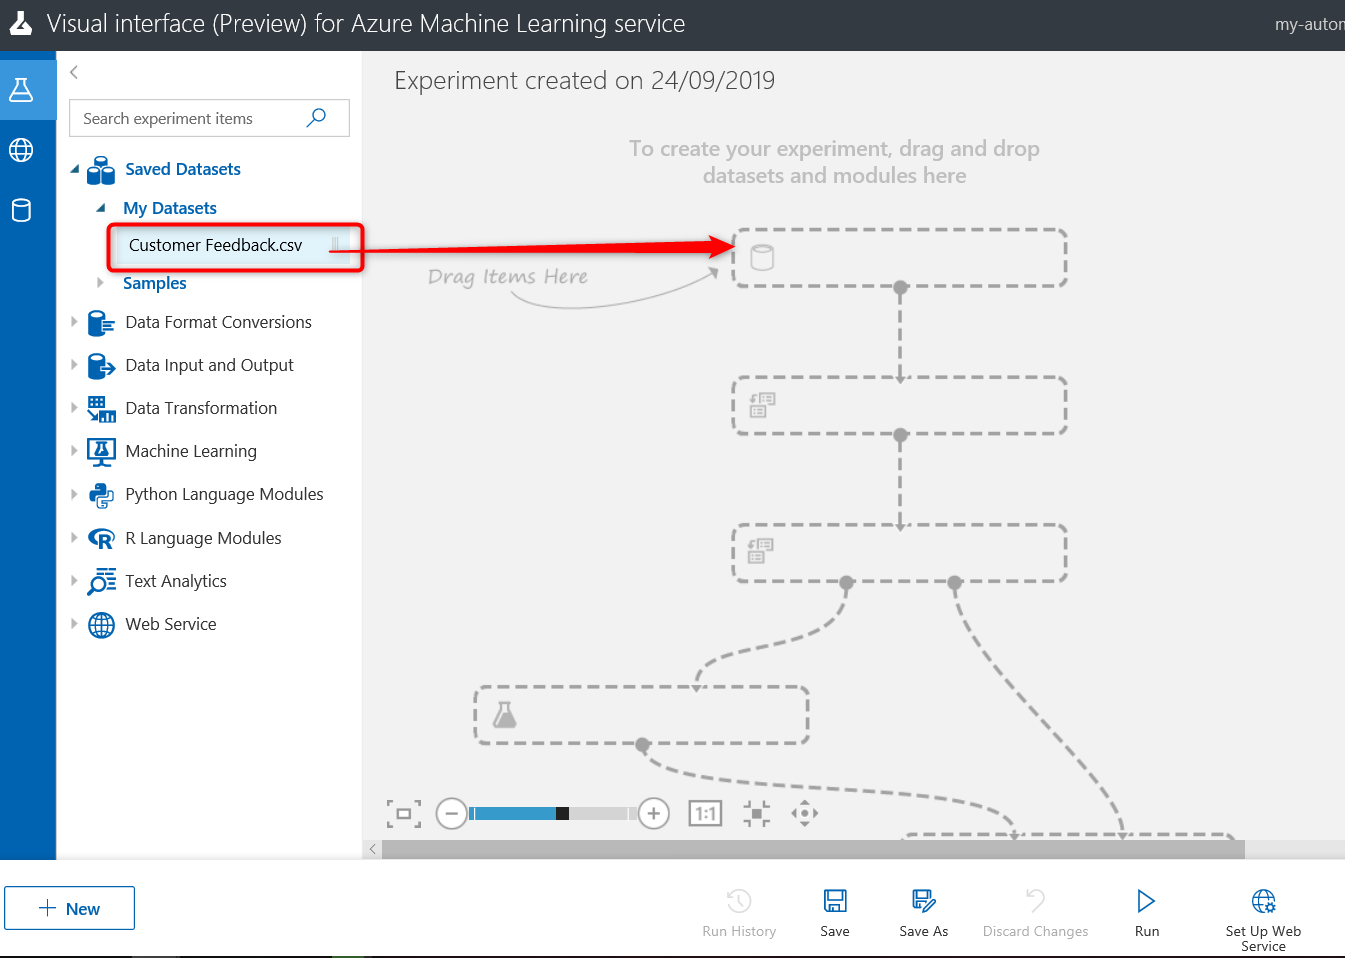
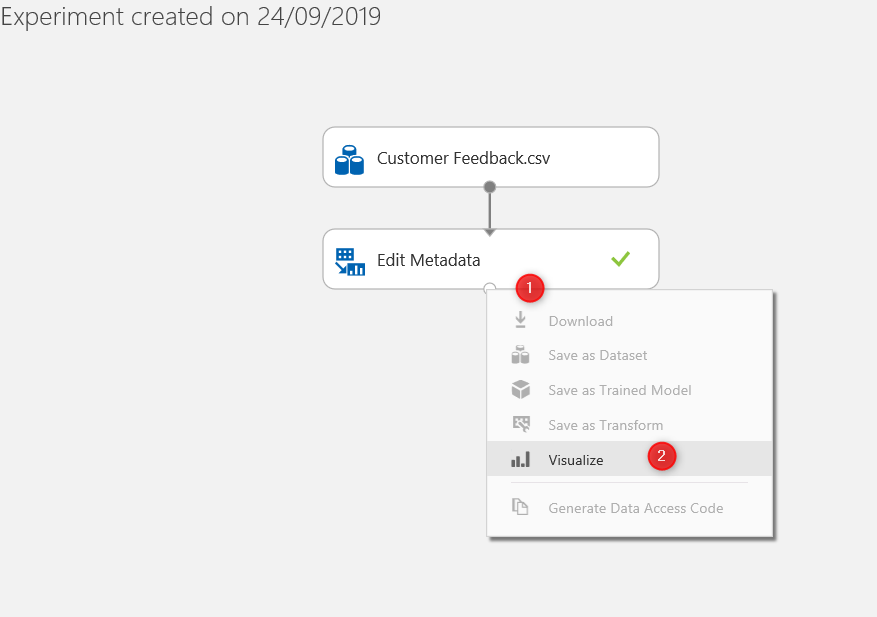
Now in the experiment same as what we have in Azure ML Studio, you able to drag and drop the imported dataset into the experiment area. Then, select the Select Edit Metadata, to change the customer Rating, to the categorial variable.

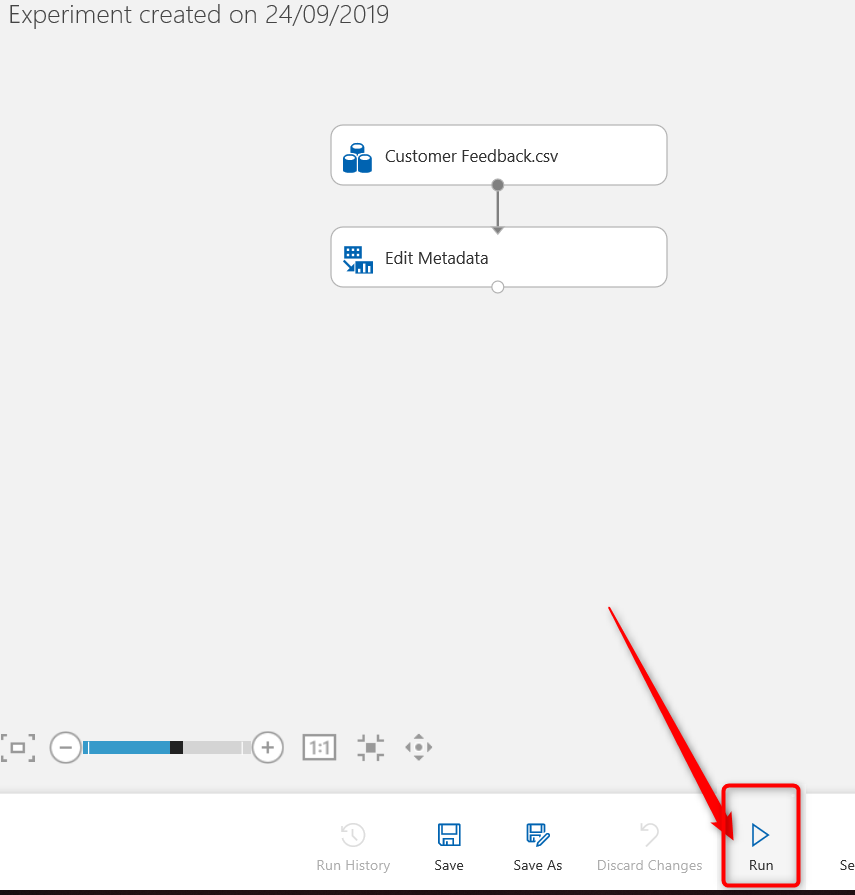
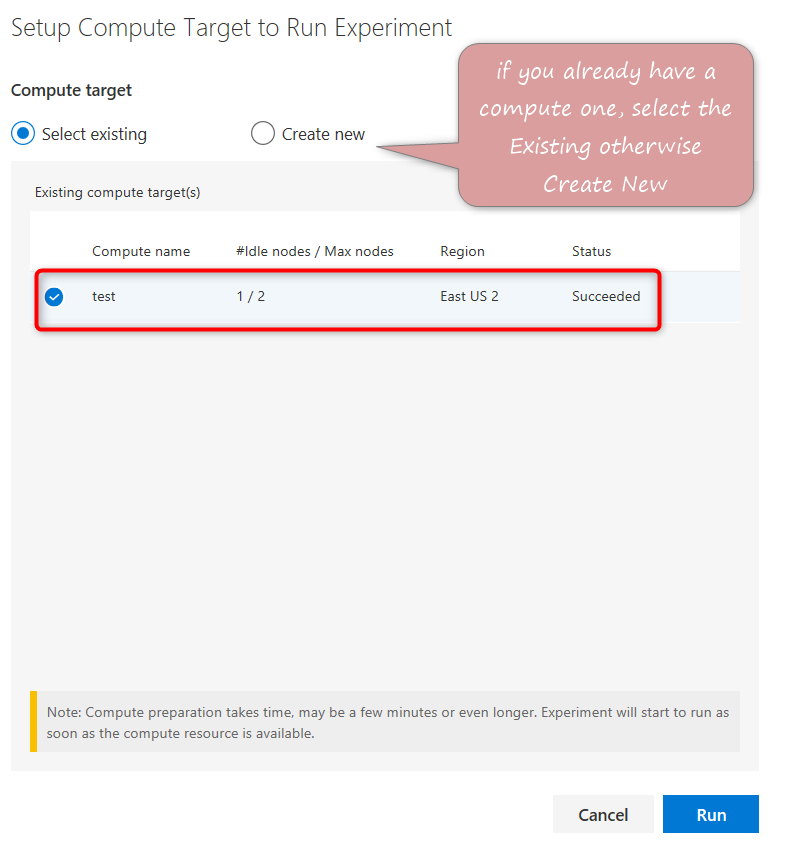
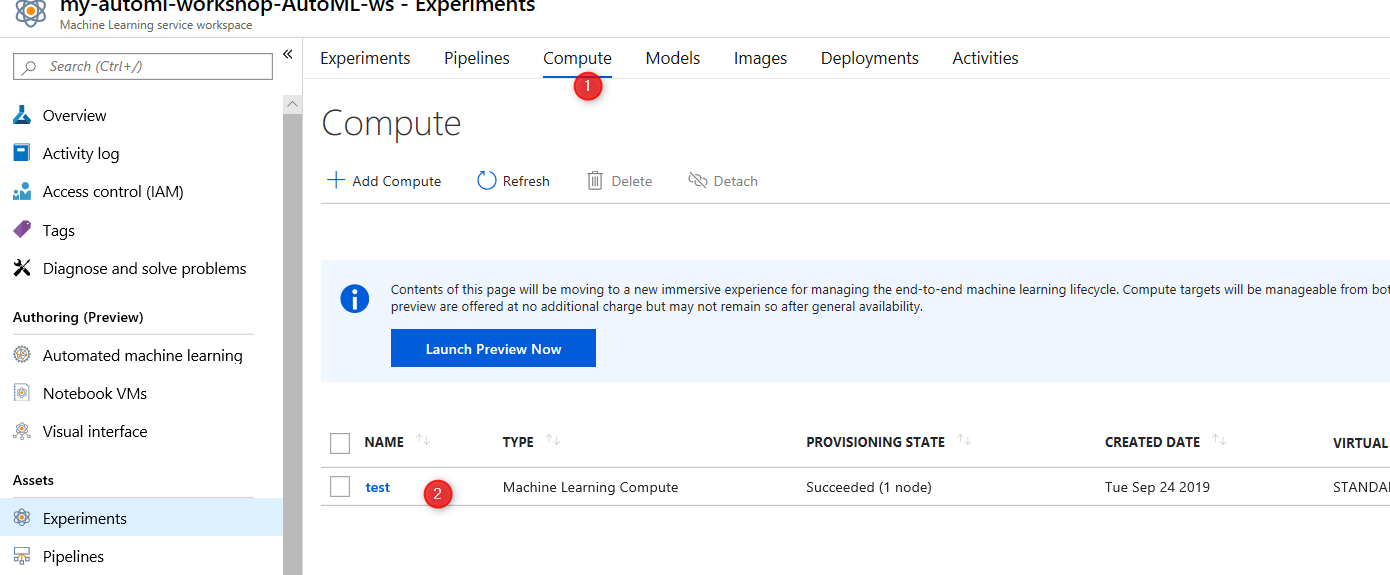
To see the result, you need to run the experiment, to run it we need to identify a new Compute (Virtual Machine) to run the model on it. If you already have one just choose it, otherwise, you need to create a new Compute.
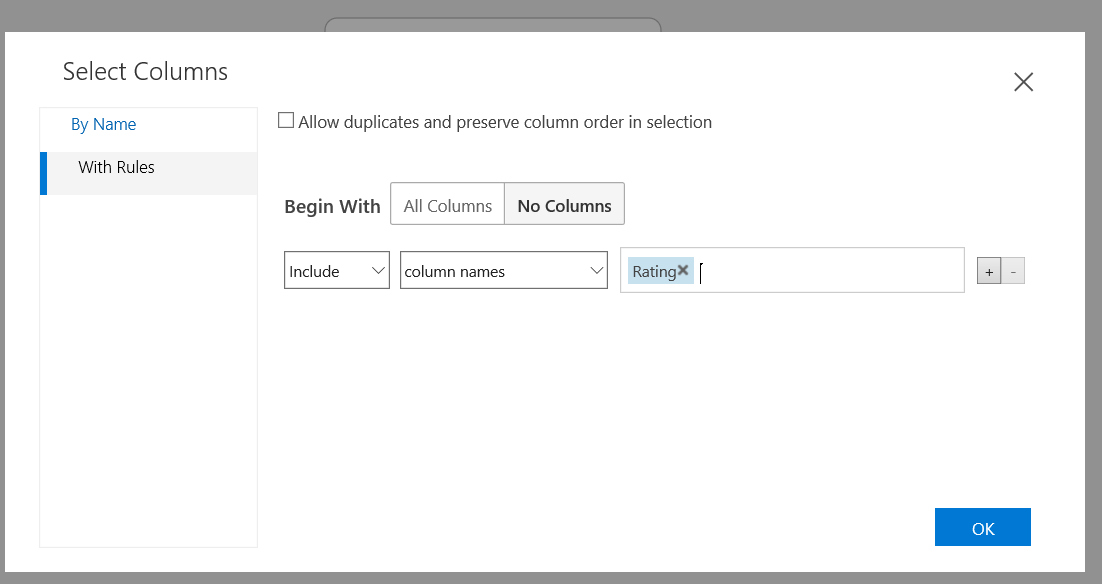
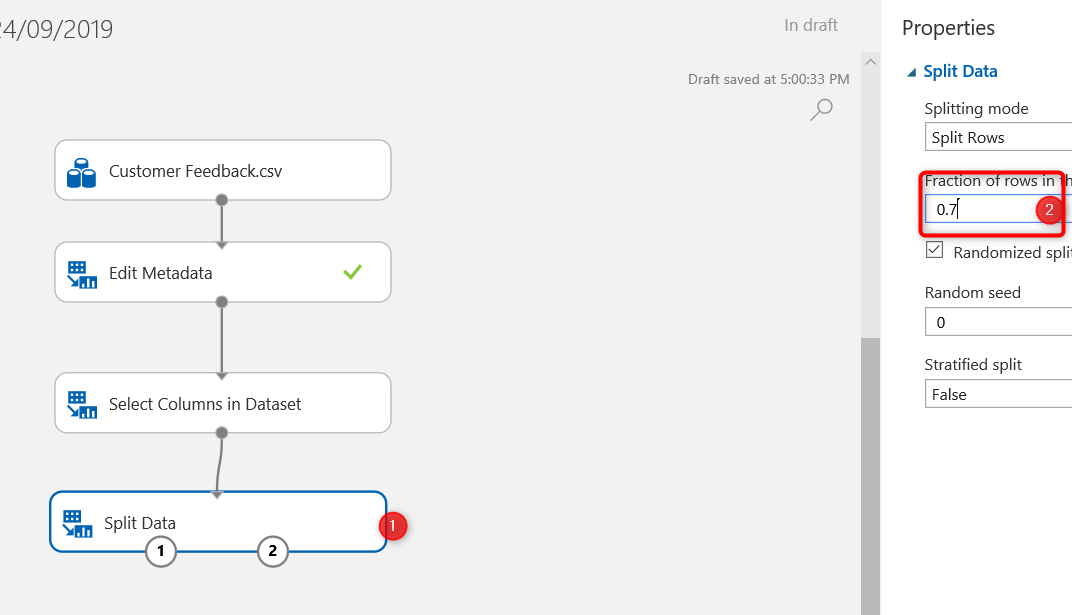
Then from the dataset list, I just select Tenure, Ticket Count, Role in Org, Company Size, and Rating.
Then same as Azure ML Studio, select the column in dataset and split data.

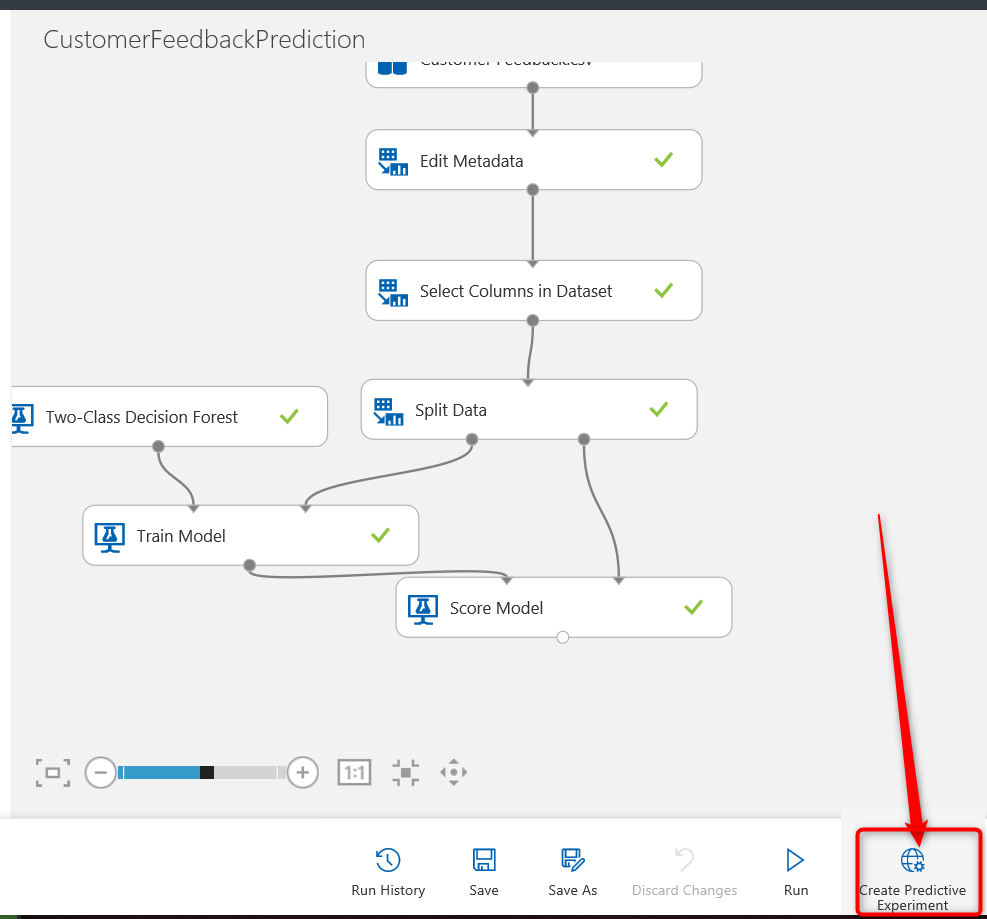
In this model, I am going to predict the customer rating, I use the two-class decision forest mode and then run the experiment, the experiment will be run on the virtual machine.
Then click on the Create Predictive Experiment.

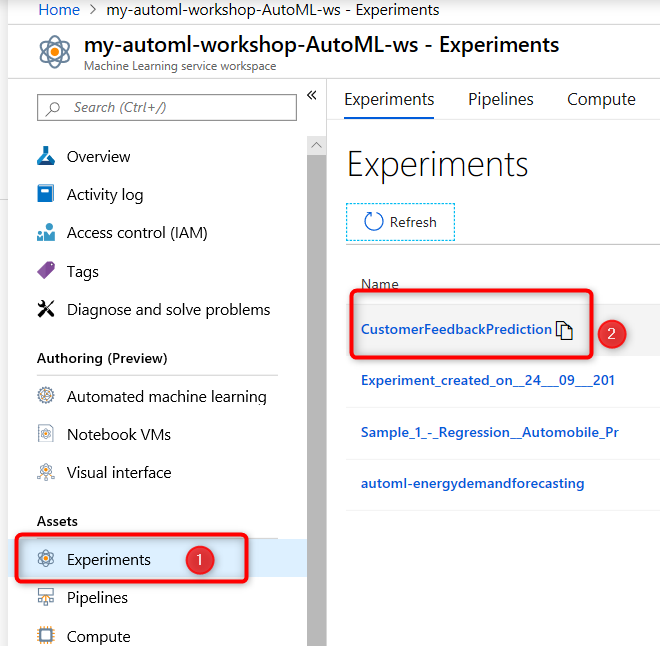
The Experiment has been created, to see it in the Experiment list along other Experiment created using other Azure ML Services like Automated ML. Also the Compute will be shown in the list.
In the next post I will show how to deploy the experiment, and deploy it.
[1] https://docs.microsoft.com/en-us/azure/machine-learning/service/ui-concept-visual-interface


