
In the last post, I have explained how to do time series forecast using “Exponential Smoothing” approach in Power BI. I start to explain the main parameters that we need to set up. The main concepts behind of most of these parameters have been explained in previous posts (Post 4, Post 3, Post 2, and Post 1).
In this post I am going to talk about the main parameters we need for doing forecast using “Exponential Smoothing”.
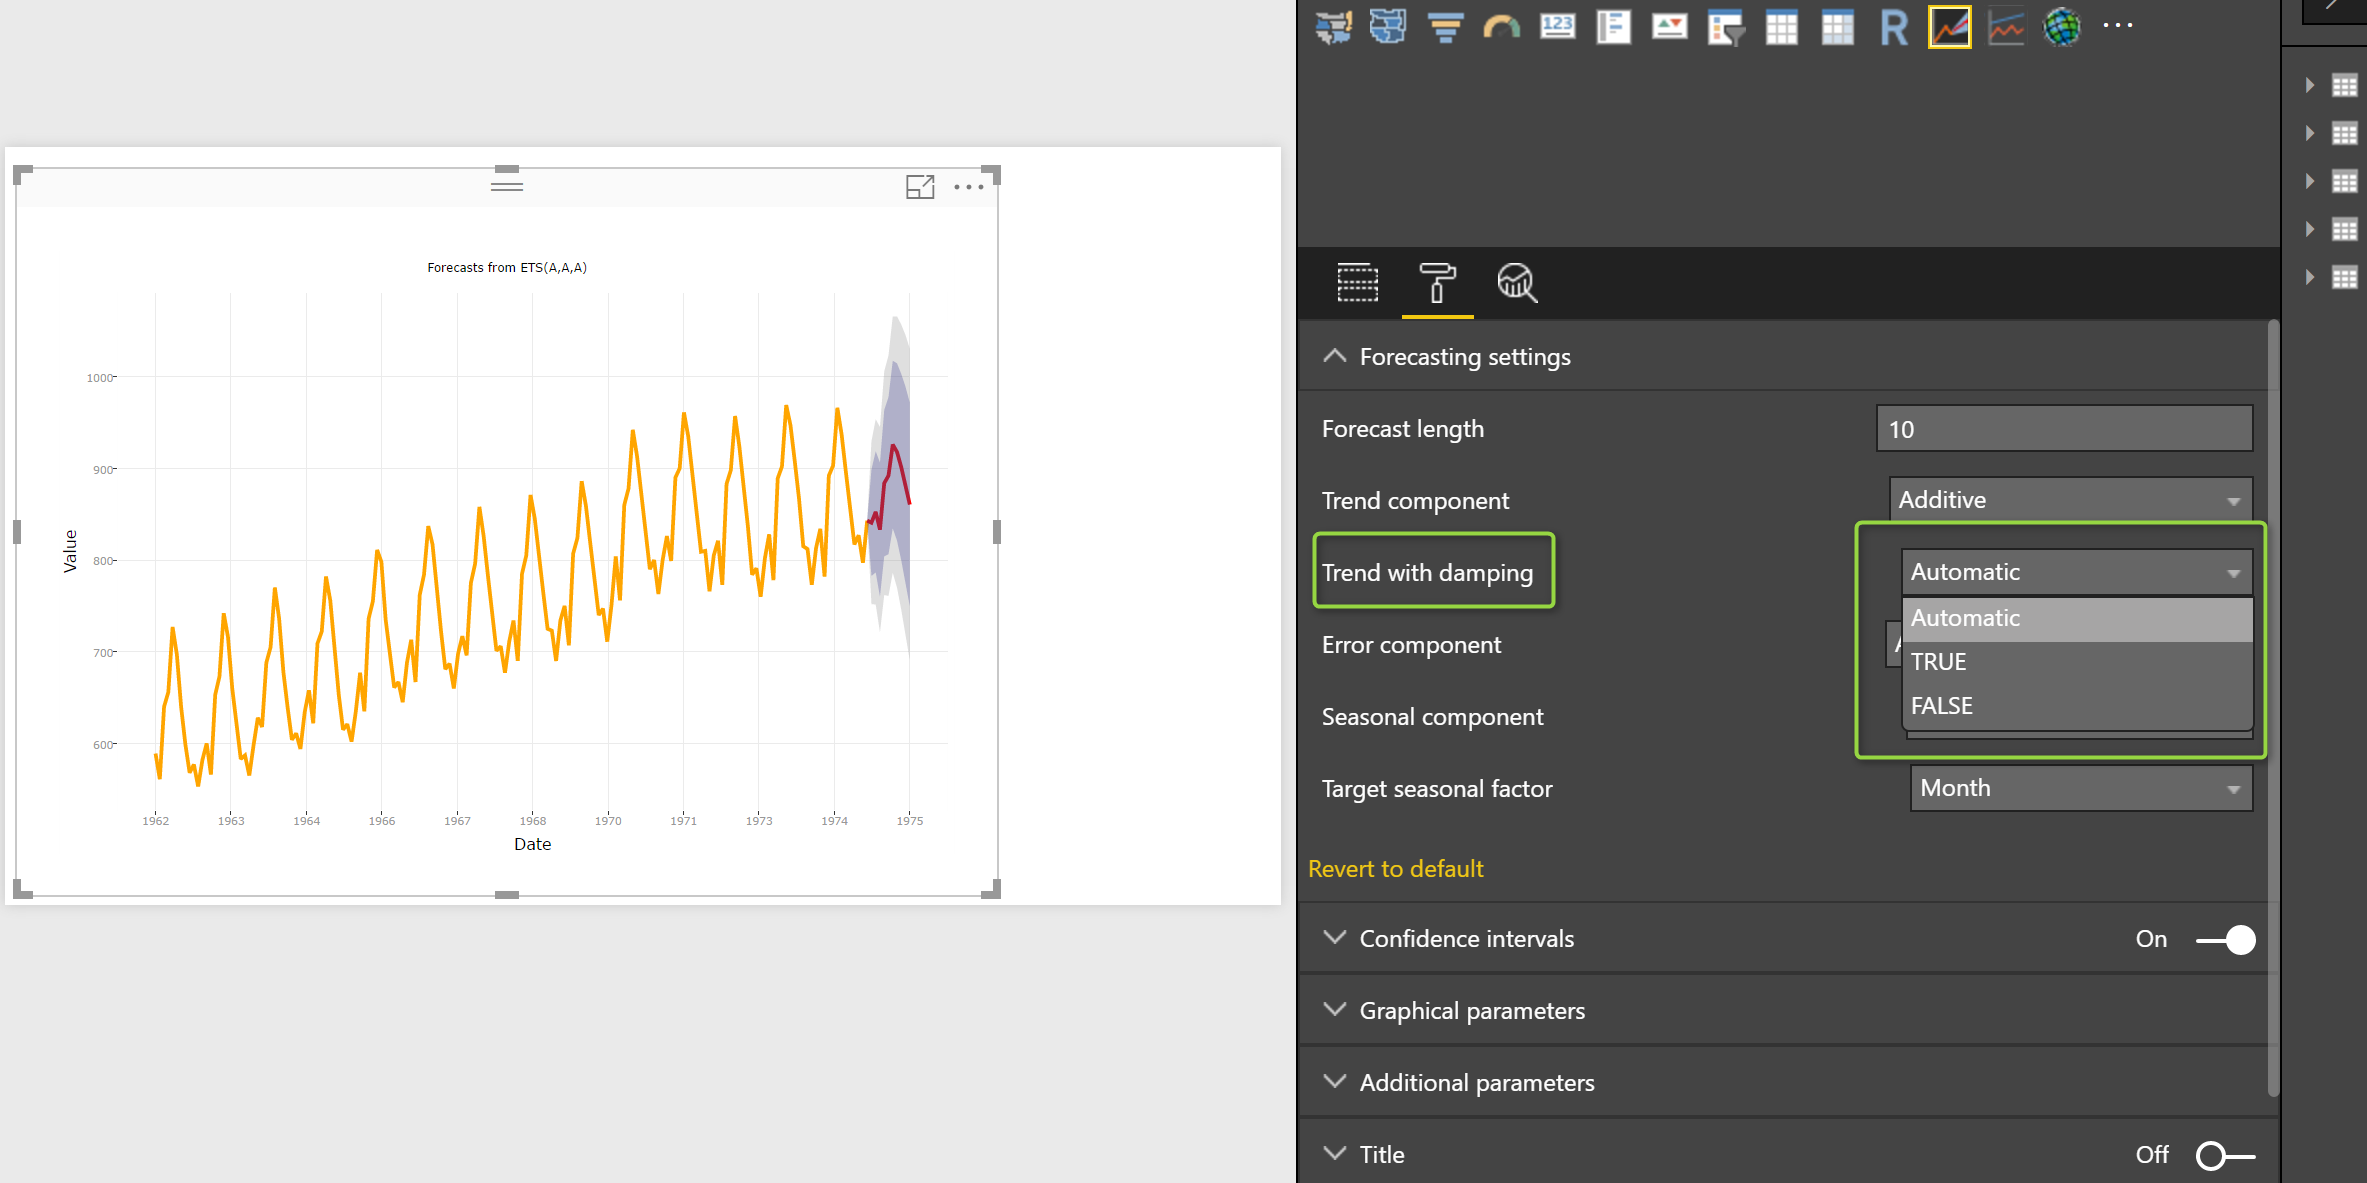
the other parameters that I did not explain in the last post was “Trend with Damping”
Trend with Damping
Dampening trend can be helpful when we have uncertain and complex long term forecasting that the forecast may lead to unaccurate result. So for enhancing the forecasting and reducing the error, we use the dampening Trend approach. So if you going to forecast for a long date forecasting it is better to this parameter to true, or you just put it as Automatic.
The other parameters is “Error Component”
Error Component
if you remember from decompose chart (below picture), we have three main components in a time series,: trend, seasonal and random (error).
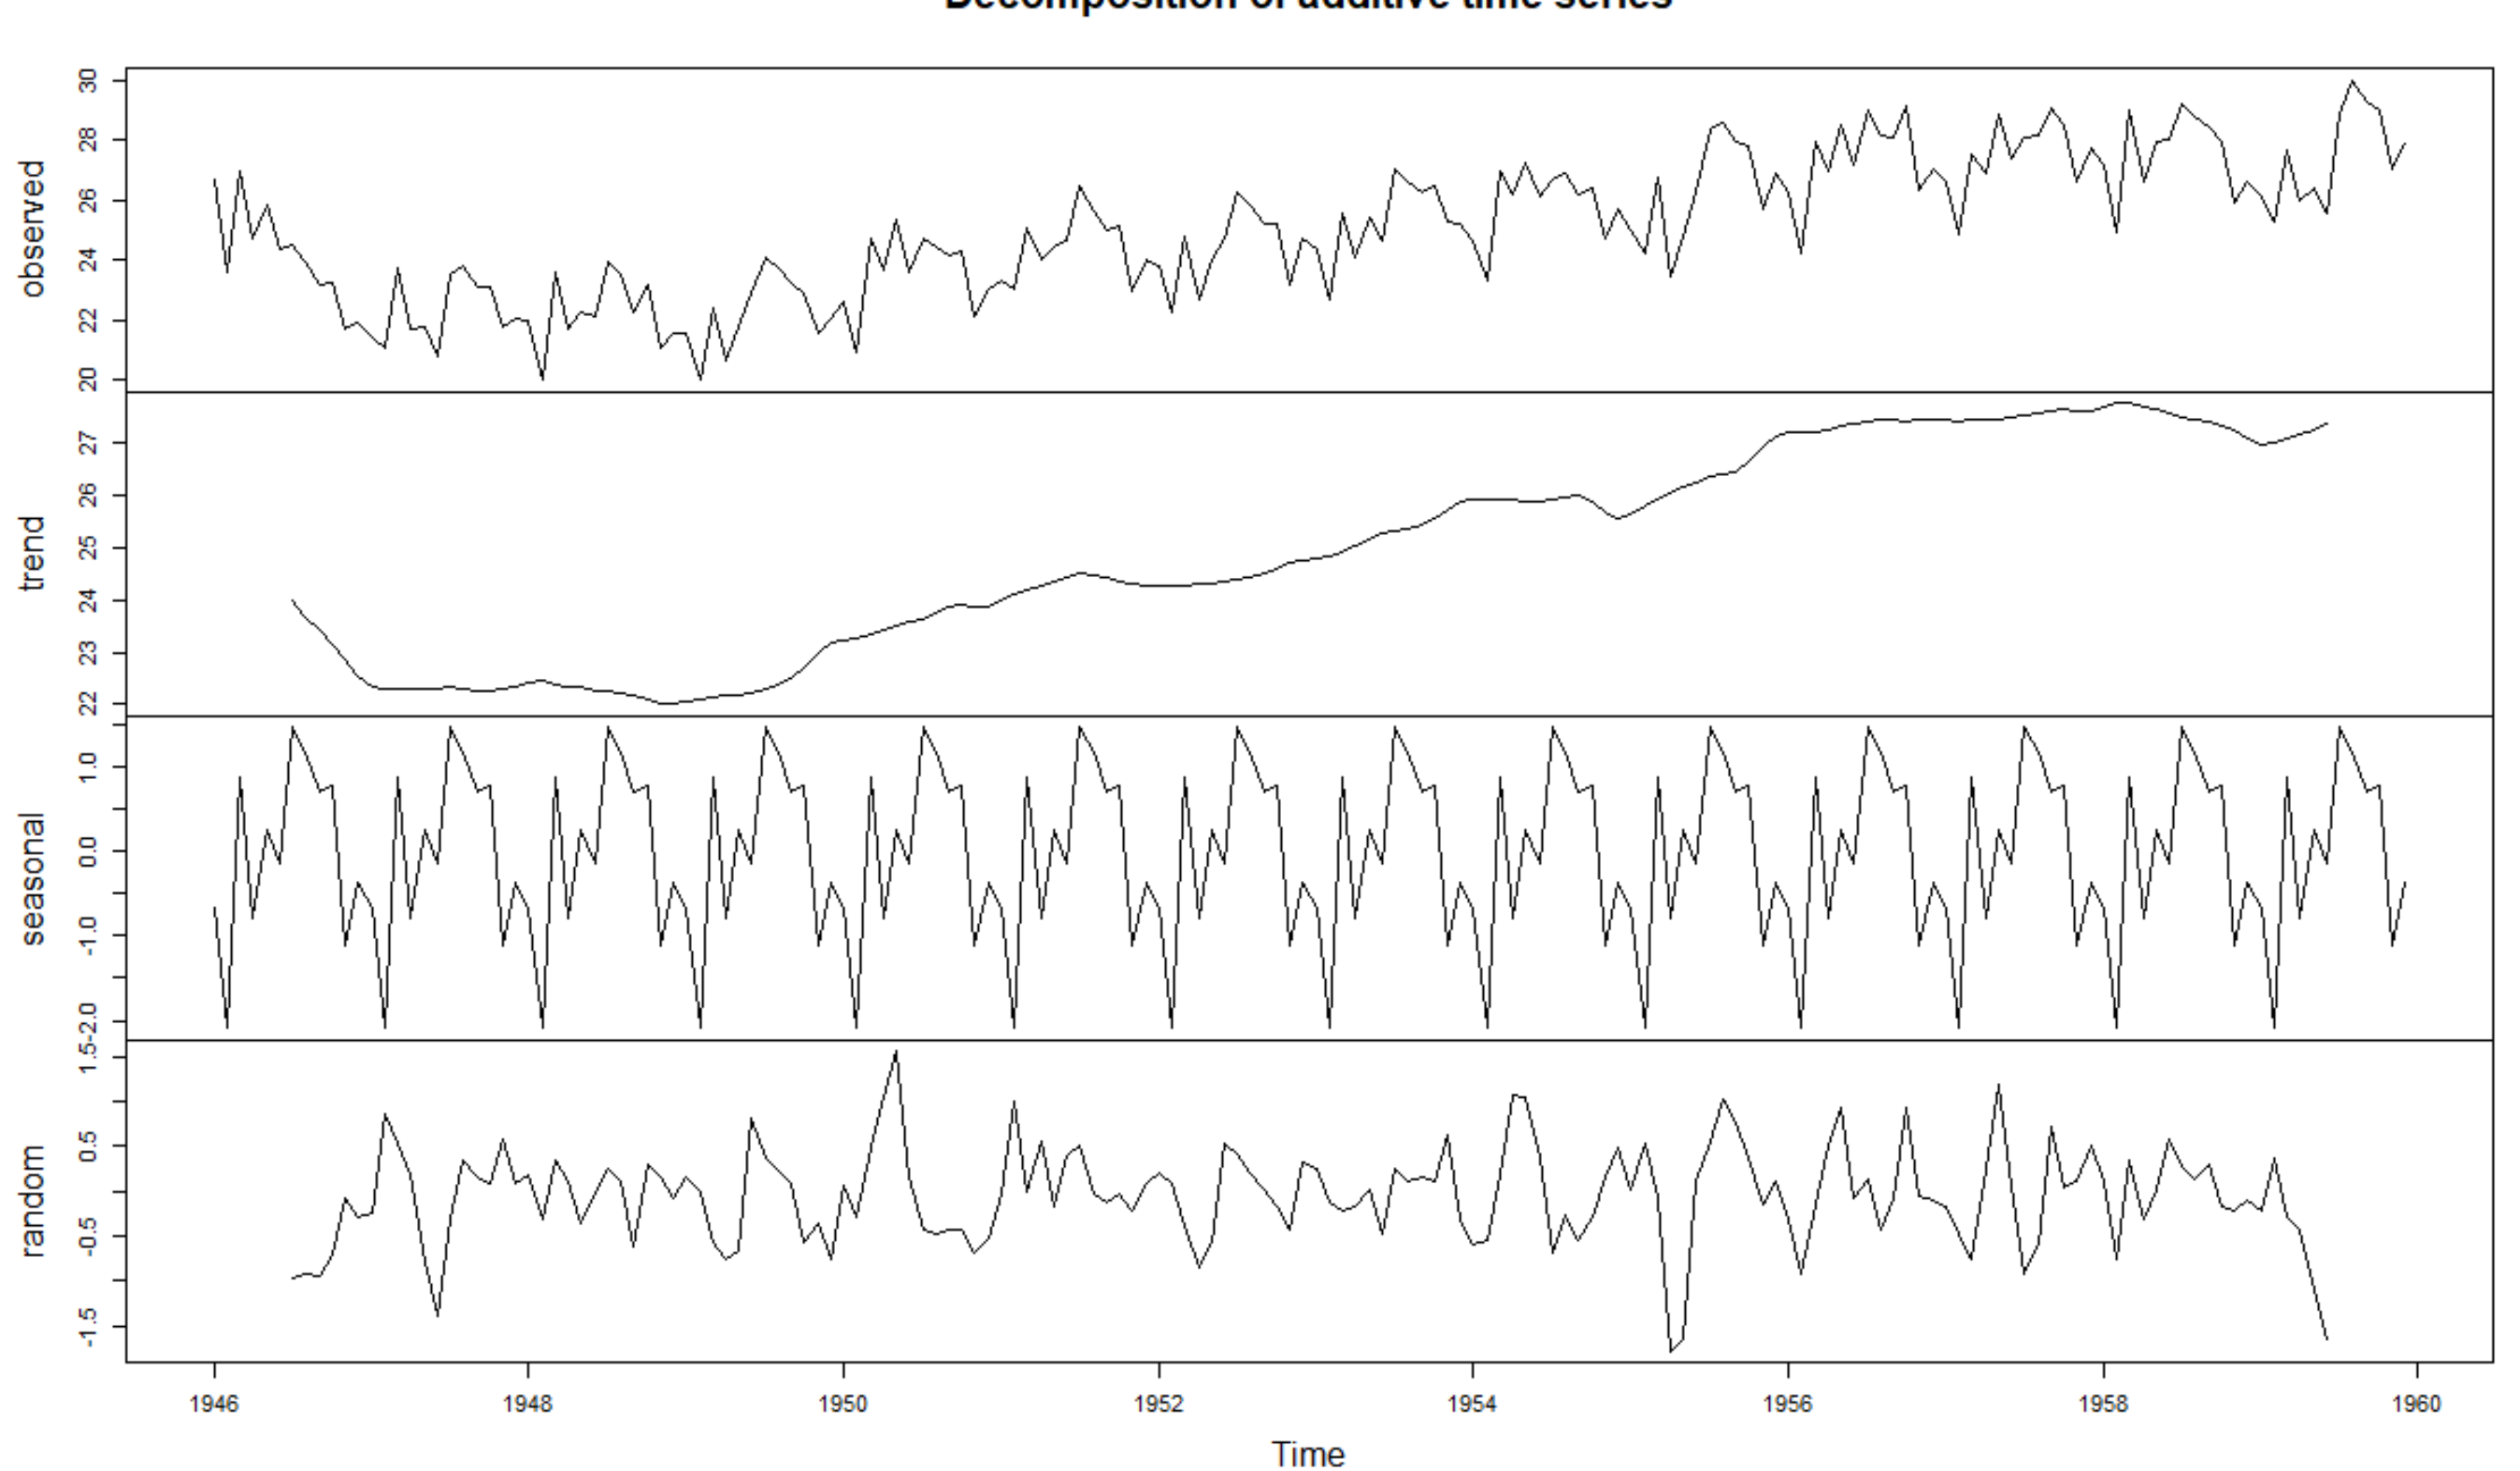
In the last post, for explaining the “Additive” and “Multiplicative” , you see that we have three main elements :Seasonality, Trend and Residual (errors)
In Power BI for all of these elements we able to identify their impact as Additive or Multiplicative (see the below image)
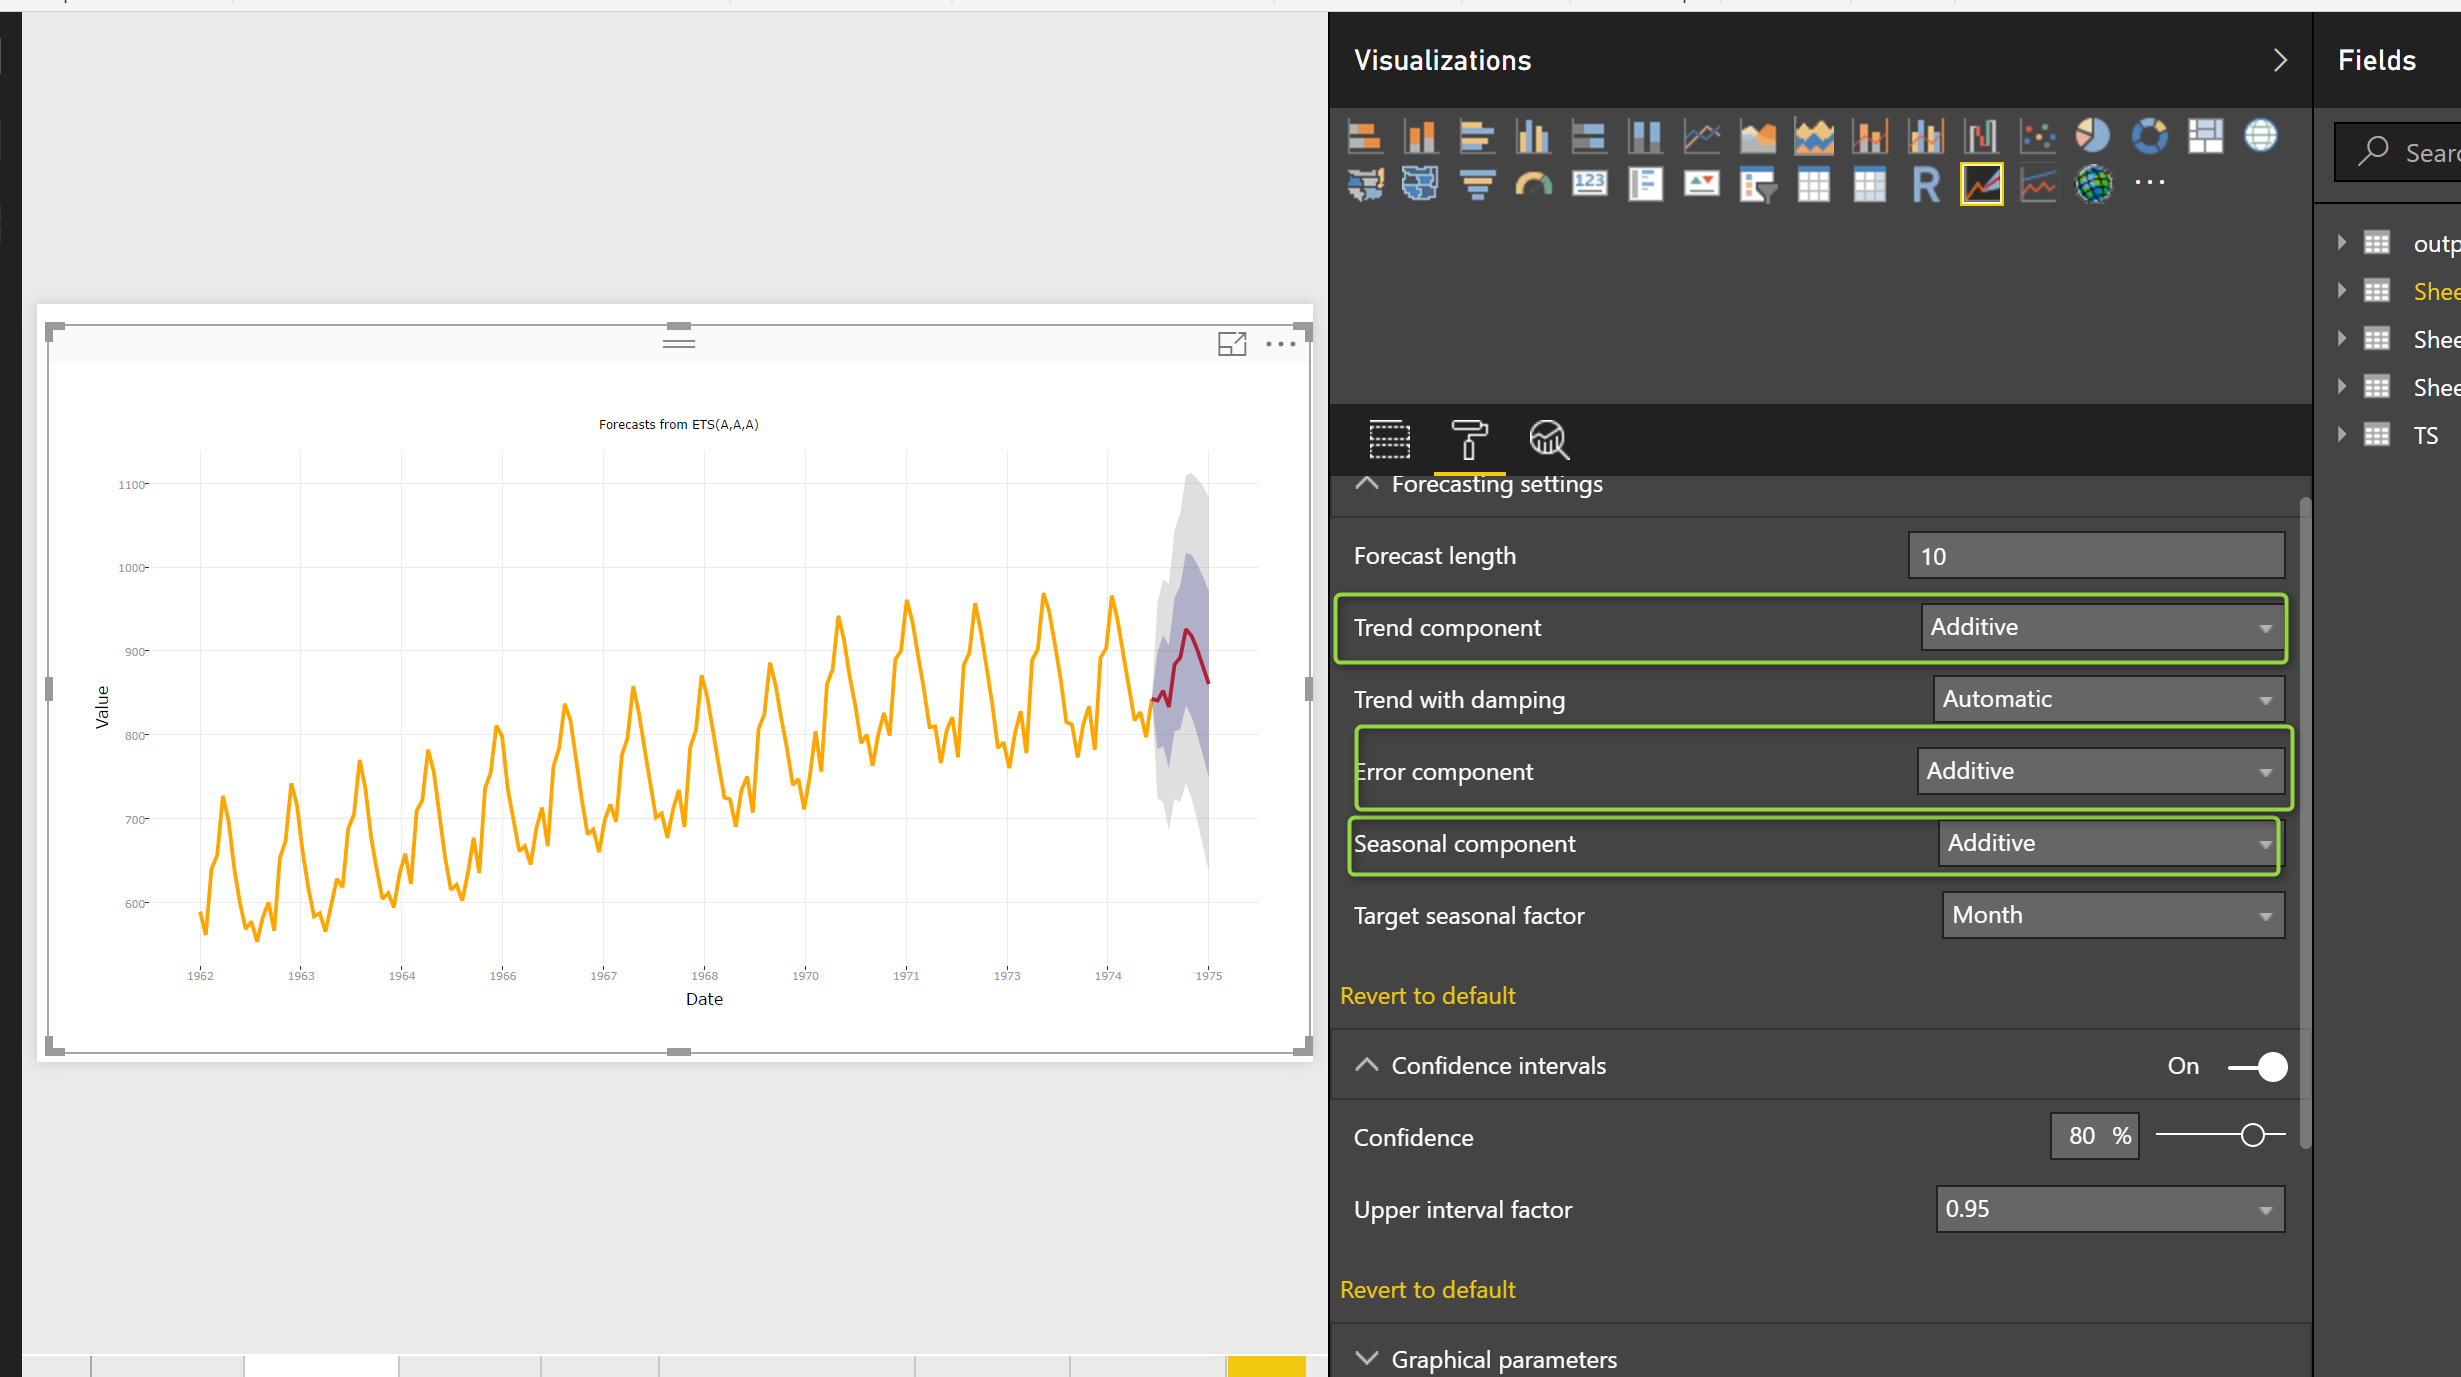
The other Parameters that need to be set up is “Target Seasonal Factor”.
Target Seasonal Factor
The data that we want to forecast may be related to a yearly trend like annual sales, or it may be related to hourly changes like the temperature that is collected from a sensor. The collected data can be varried from yearly to hourly range. This parameter help us to specify the date measure from Hour to year.

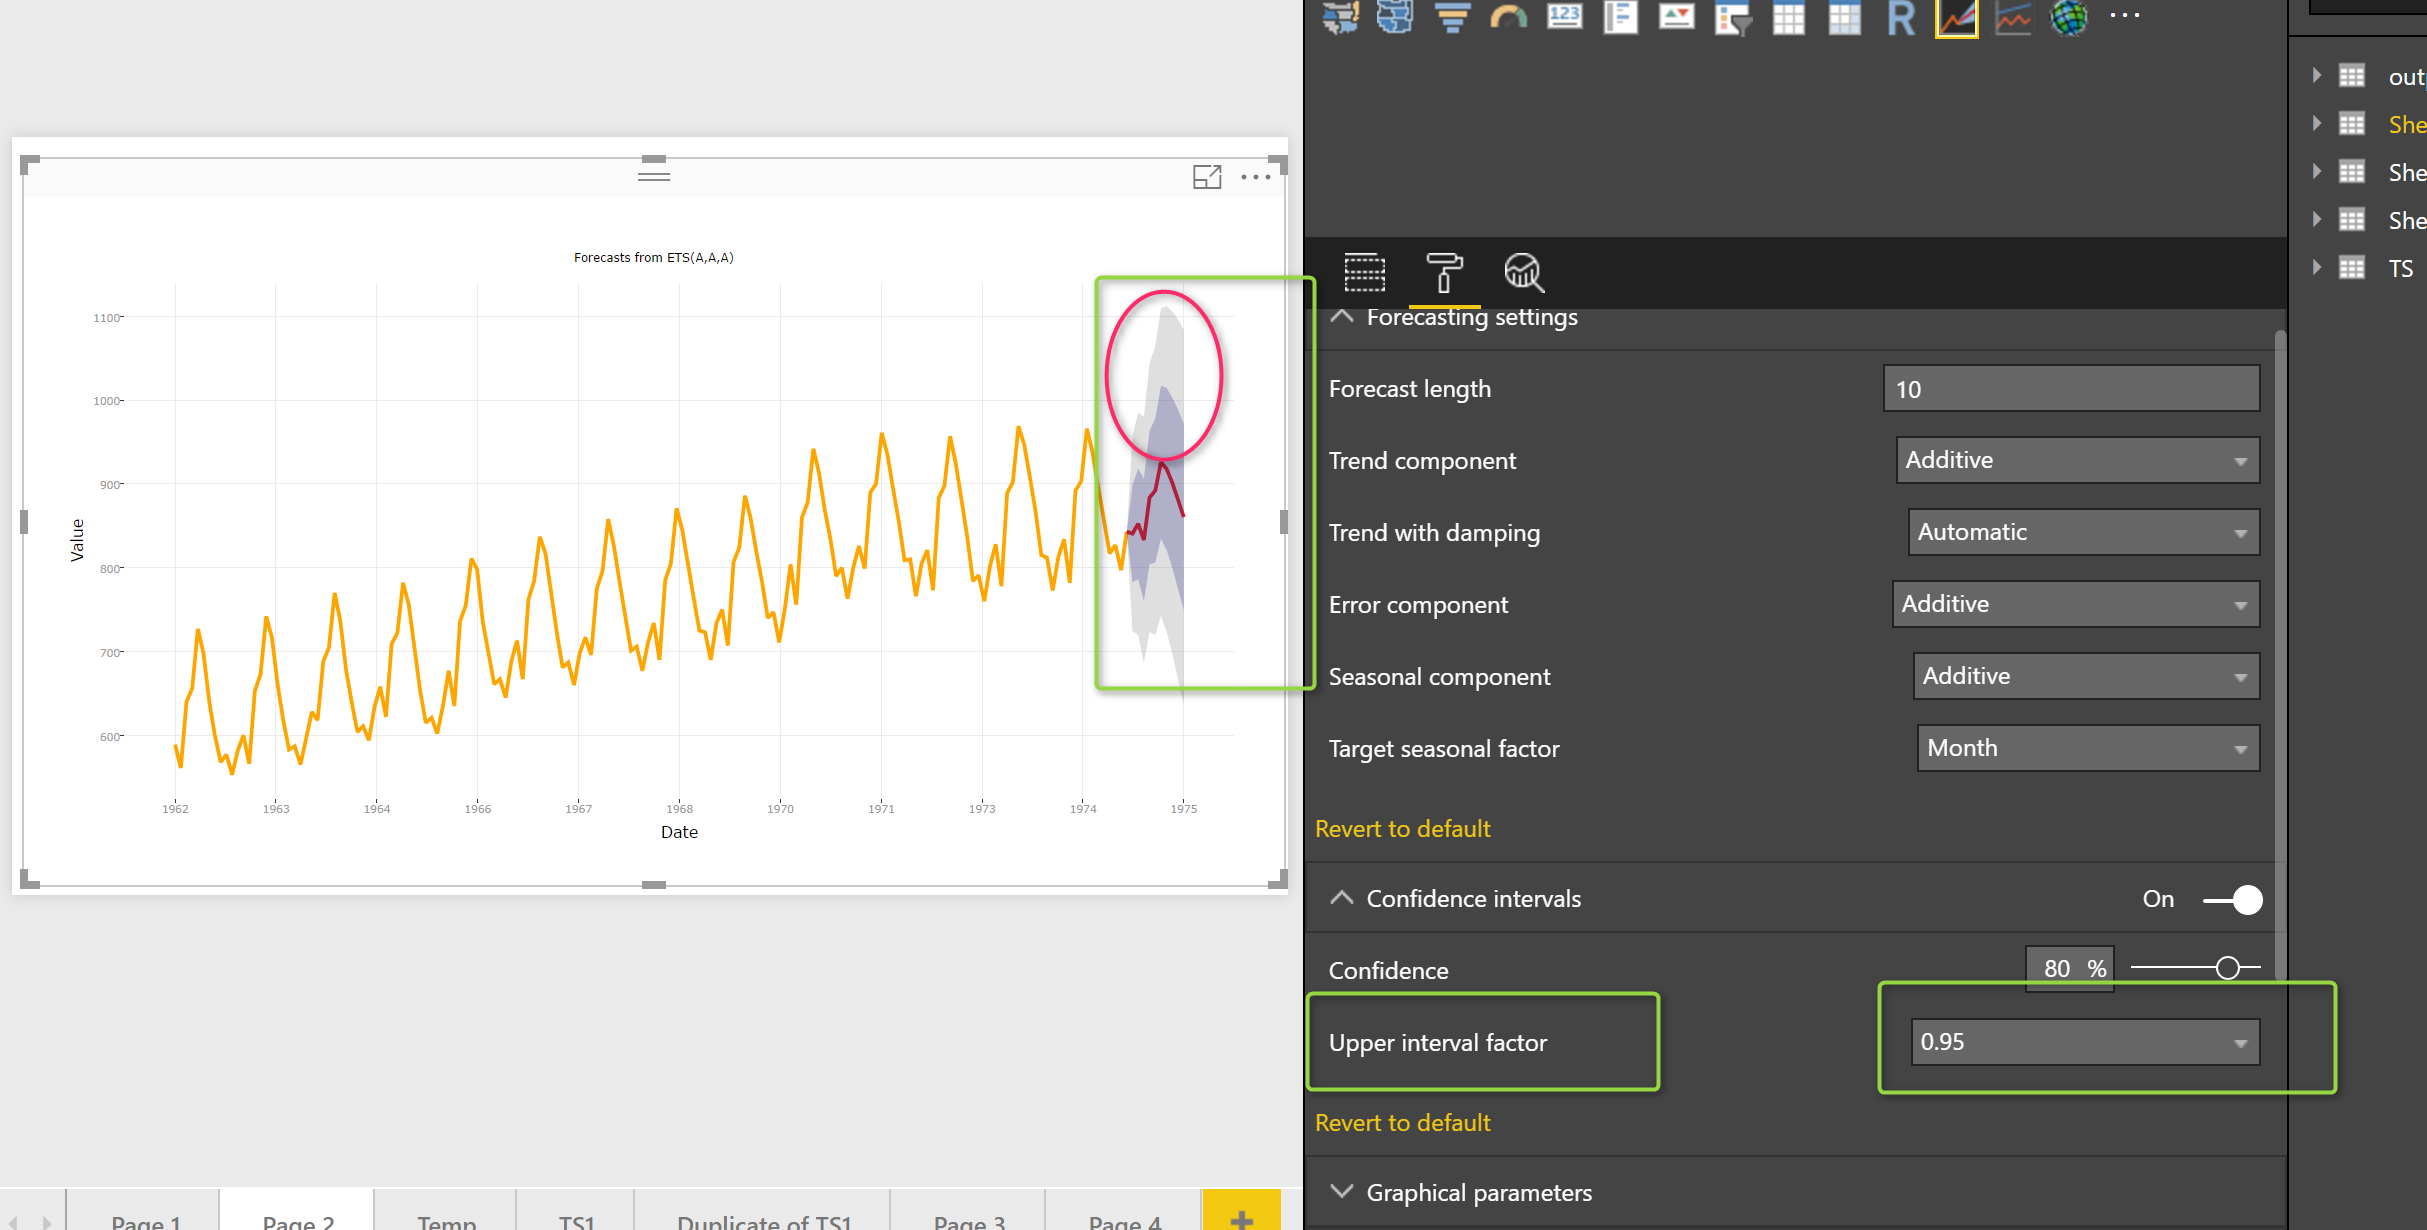
Finally, in the “Confidence Interval”, we have two more parameters, that would be nice to set them up.
Confidence
So here we able to spesify the confidence precentage from 0 to 100. for instance fro confidence of 90%, we able to see for 90% of data how much the forecast can be varied for the top point (925) in upper range from 968 (darker area) to 1085 (ligher) bound
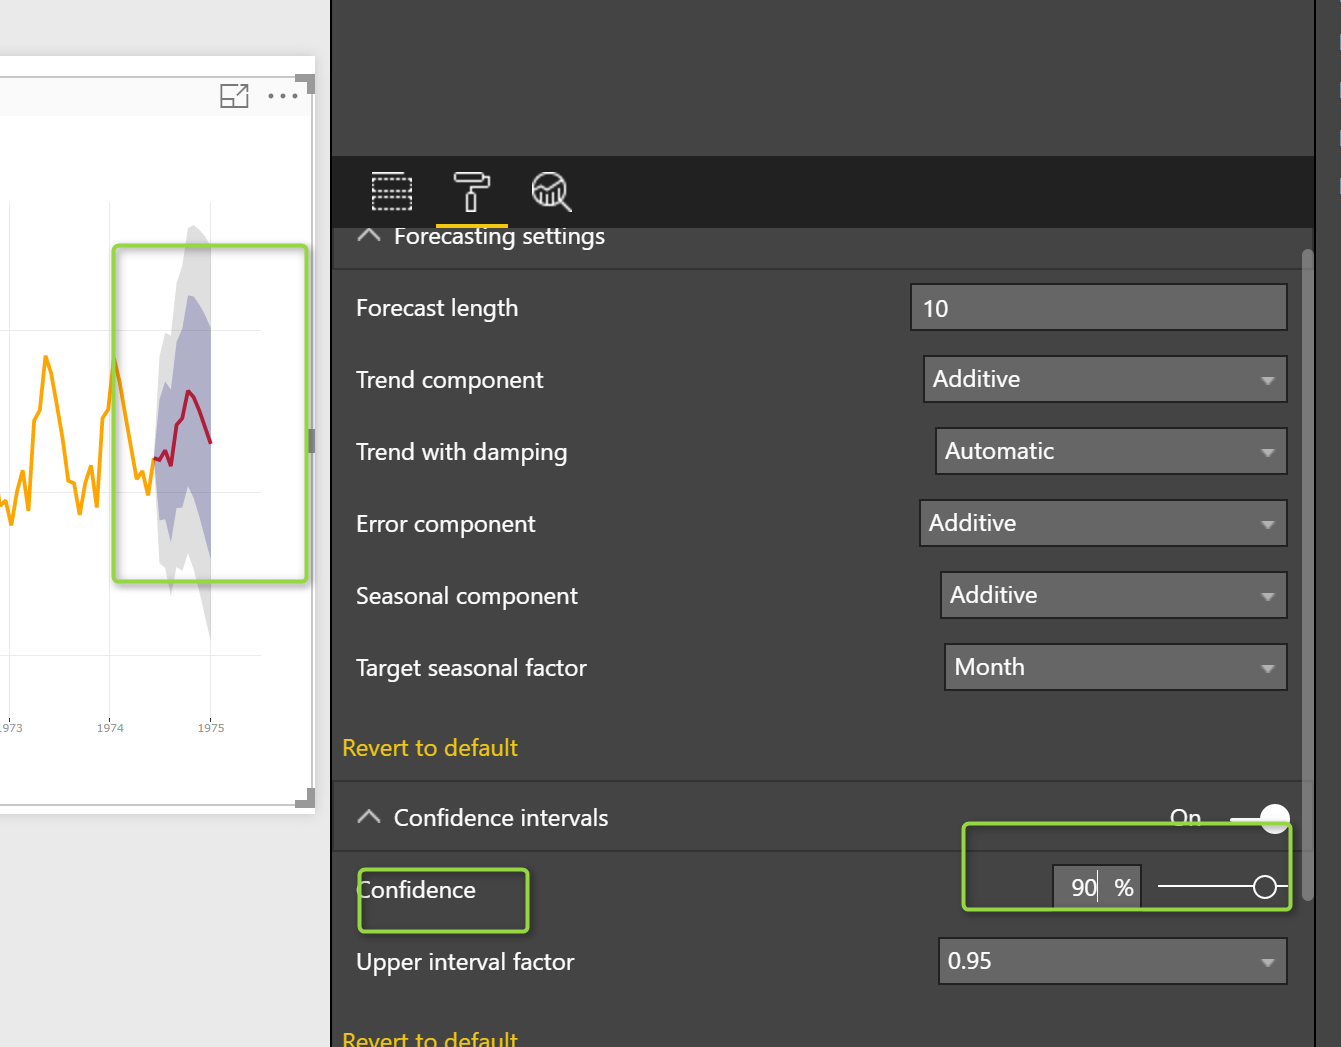
If I change the the confidence to 50 % you see the value for upper and lower level will change in certeanly and in forecast interval.

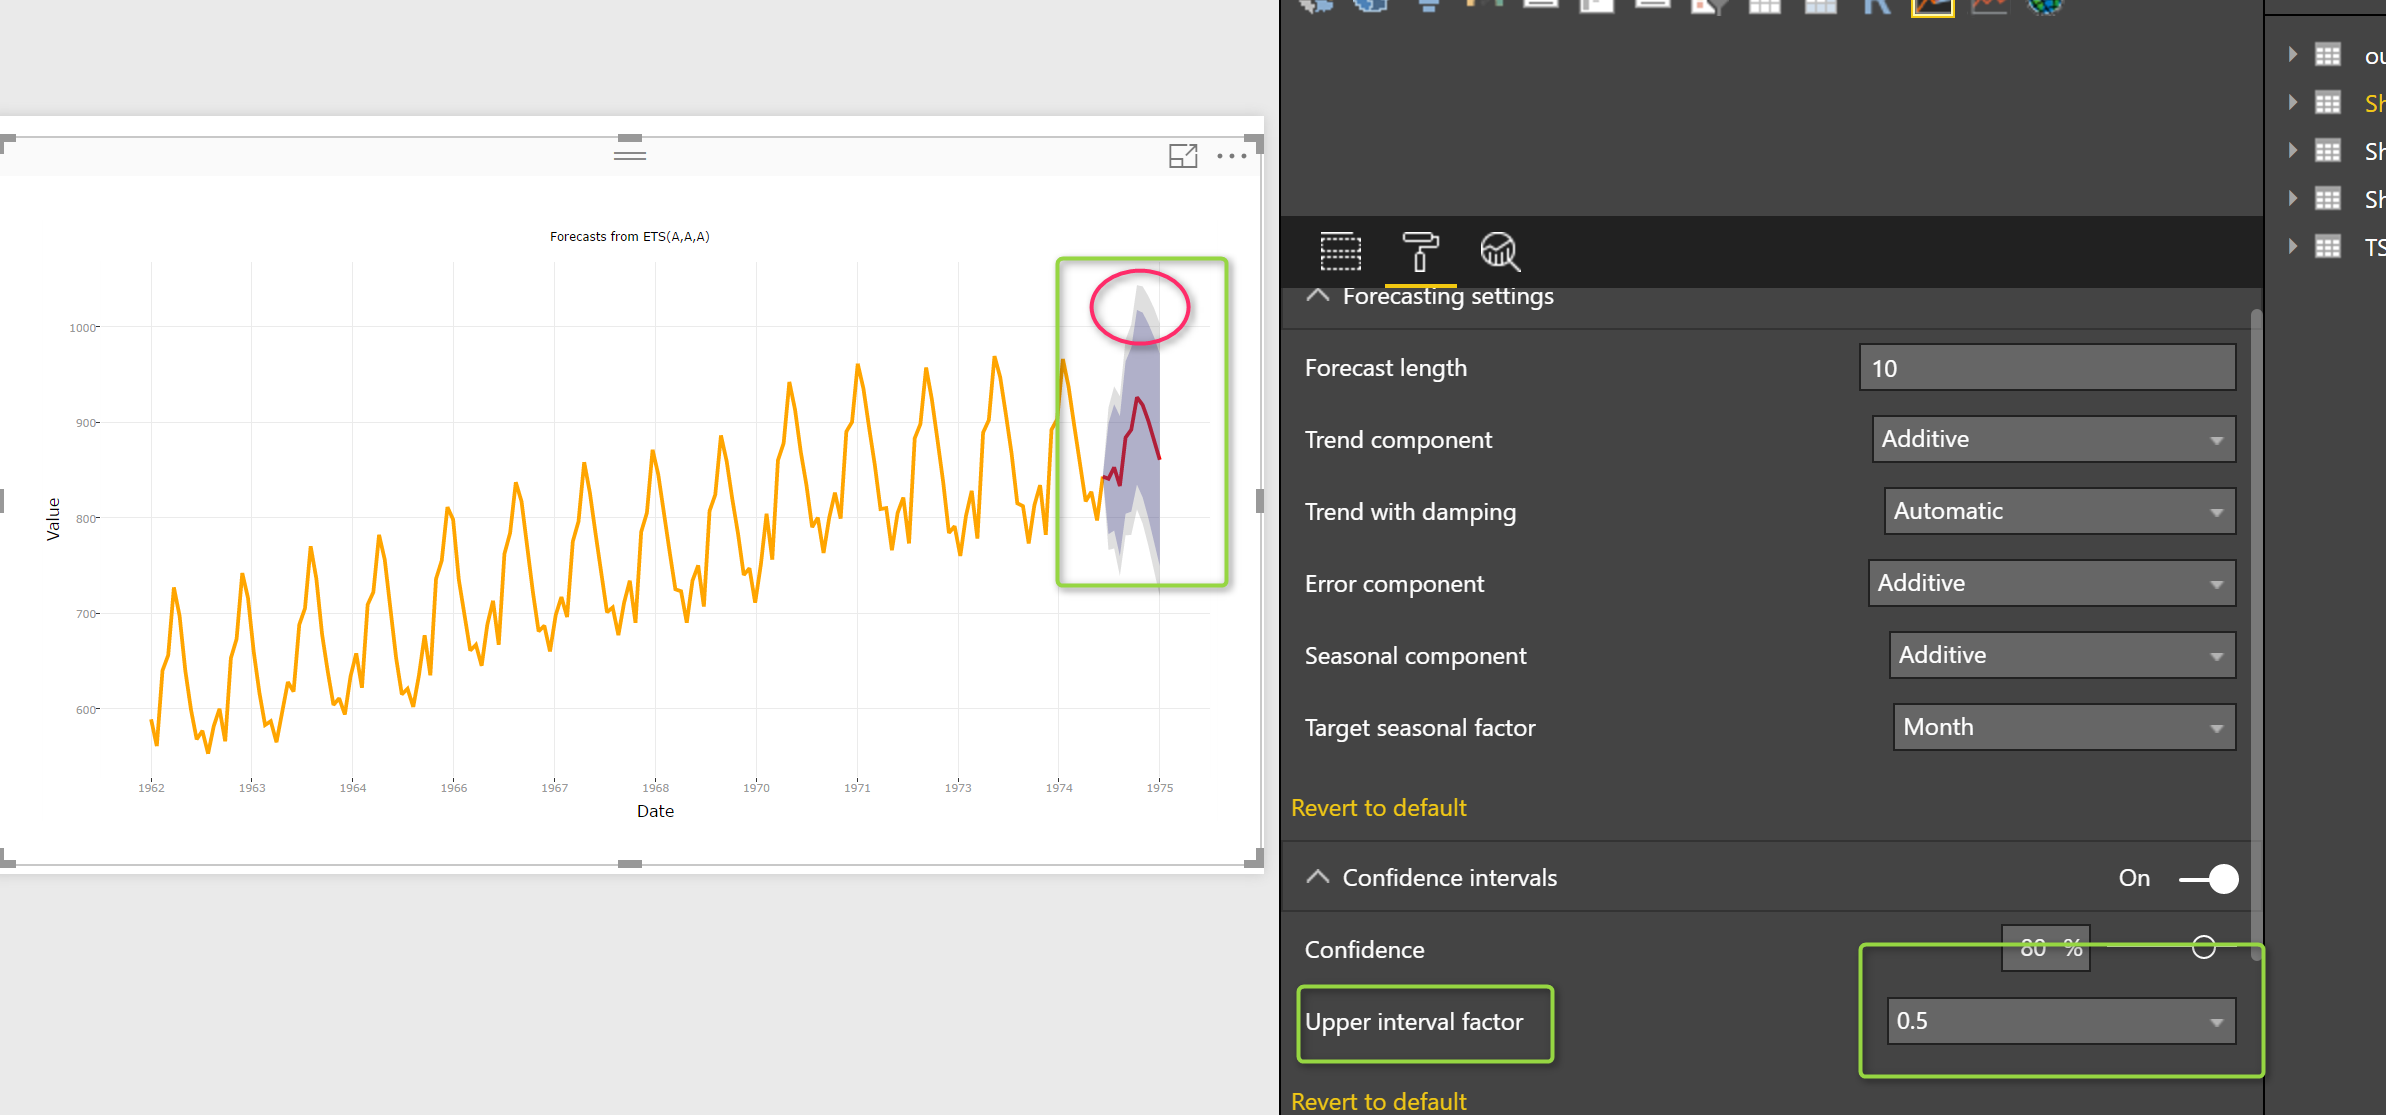
Upper Interval Factor
the other approach to do if then analysis is to spesify the upper level
So if I change it to 50% the upper and lower level are the same as below
[1]https://machinelearningmastery.com/time-series-forecast-uncertainty-using-confidence-intervals-python/
[2] https://www.otexts.org/fpp/2/7
[3]http://www.dynamicinfo.nl/forecasting-with-power-bi/


