

I often get this question after I explain about the star-schema. The question is that both my dimensions are filtering my fact table values, but how can I get one dimension filtering another dimension? for example, how can I get only the list of products that have been purchased by this customer? In this article, I’ll explain how you can do that with the star-schema.
Sample dataset
The sample dataset for this example has only three tables below: (download the Power BI file at the end of the article)
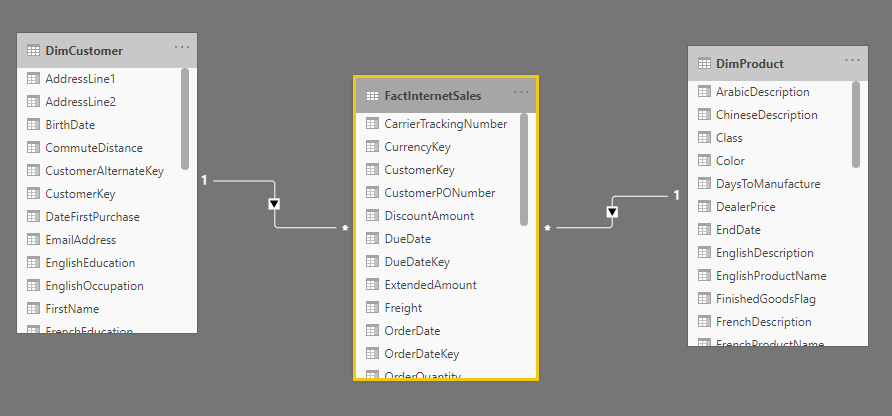
DimCustomer and DimProduct both have one-to-many single directional relationship to the FactInternetSales. This is a simple star-schema model.
We also have a report like below;
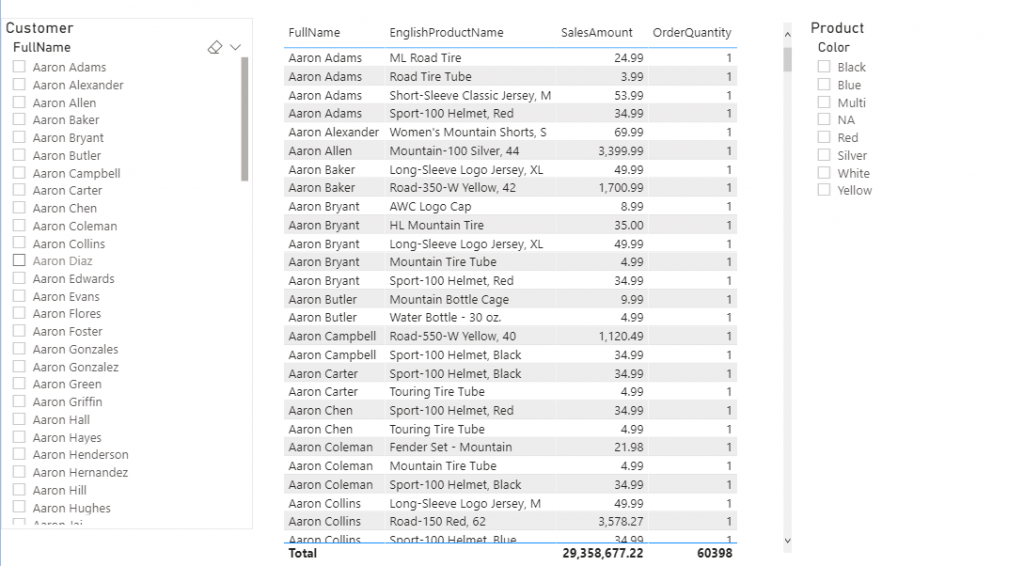
In the report above, with selection of the FullName (from the DimCustomer table) slicer, or Color (from the DimProduct table), the table visual gets filtered. But what about other scenarios?
Only showing Products that this customer purchased
What if your requirement is to filter the Color slicer based on only products that the selected customer have purchased? In the above report, the Product slicer doesn’t get filtered by selection of the Customer slicer.
Why Filtering Doesn’t Happen Automatically?
You may ask why the product slicer doesn’t get filtered? The reason is that the direction of the relationship is from the Product table to the Fact table, which means only the product table can filter the fact table’s data, not the other way around. I have written a full article explaining the direction of the relationship and I recommend you to read it here.
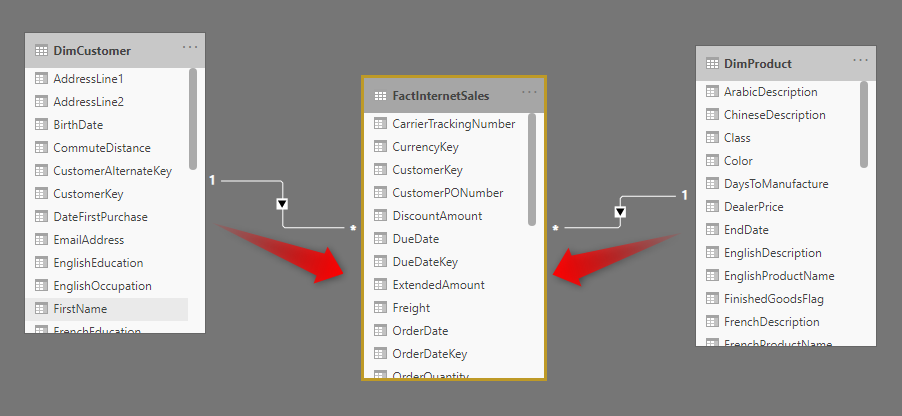
This is normally the case that in a star-schema, the fact table is in the middle, and gets filtered by all dimensions, but dimensions can’t filter each other.

How to Filter One Dimension By Another?
If you have this requirement that one dimension should get filtered by another dimension, there are two ways to implement it. One is to use both-directional relationship (which I don’t recommend). Another is to use Measures for filtering.
Why not both-directional relationship?
Both-directional relationship comes with two major problems. The first problem is the significant performance impact of this. The second problem is that you cannot apply both-directional relationship all the time, it brings circular reference and ambiguity to your data model.
Using a Filter Measure
Another option is to use measures as a filter, which is what I called here as Filter Measures. You can create a measure like this:
Sales = SUM(FactInternetSales[SalesAmount])
This is a very simple measure that calculates the sum of the SalesAmount from the fact table.
You can use this measure in the Product slicer (Color slicer) as a visual level filter and set the value to be greater than zero. This means that only show Product Colors that there are sales for them based on the current selection of other slicers in the report.
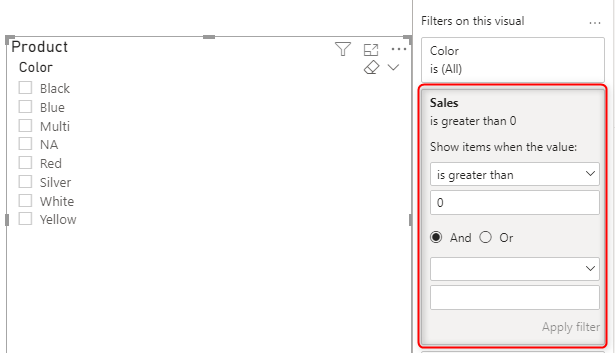
This means that now the Customer slicer can filter the product slicer, without having the both-directional relationship in the data model.
You can use this measure also to filter the customer slicer based on the product slicer if you want it the other way around.
This method is not just for slicers, it can work for any other visuals too.
If a simple expression like above doesn’t work, you can take one step further and create a measure using CrossFilter function such as below;
Filter Product =
CALCULATE(
SUM(FactInternetSales[SalesAmount]),
CROSSFILTER(
FactInternetSales[ProductKey],
DimProduct[ProductKey],
Both)
)
However, using a measure like above normally is not necessary, because as you have seen the simple measure works like a charm.
Summary
So in summary, the simple trick is to create a measure that calculates a value from the fact table. Then use that measure as the visual level filter of the visual, and set the filter to be greater than zero (or what is the threshold of having an activity in the fact table).
If you haven't read other parts of Back to Basics Series of Power BI Modeling, here they are:
- What is a Relationship?
- What is the Cardinality of the Relationship?
- What is the Direction of the Relationship?
- Data preparation; First and Foremost Important task
- What is a Dimension table and why say No to a single big table
- Basics of Modeling in Power BI: Fact Tables
- Combining Dimension Tables in Power BI using Power Query; Foundation of Modeling in Power BI
Download Sample Power BI File
Download the sample Power BI report here:
Video


Reza is author of more than 14 books on Microsoft Business Intelligence, most of these books are published under Power BI category. Among these are books such as Power BI DAX Simplified, Pro Power BI Architecture, Power BI from Rookie to Rock Star, Power Query books series, Row-Level Security in Power BI and etc.
He is an International Speaker in Microsoft Ignite, Microsoft Business Applications Summit, Data Insight Summit, PASS Summit, SQL Saturday and SQL user groups. And He is a Microsoft Certified Trainer.
Reza’s passion is to help you find the best data solution, he is Data enthusiast.
His articles on different aspects of technologies, especially on MS BI, can be found on his blog: https://radacad.com/blog.
How would I in a table filter e.g. customer names by a specific ProductKey?
if you want the values in the table to be filtered, then you need to use a measure for customer names, using the field will work as a slice and dice, where using a measure would act as a value
if you have a sales measure or a measure from the fact table, however, this works just fine. in the example in this post, it works as you said.
Cheers
Reza
Hi Reza – I have a need to show the value zero (and above). Your solution works great if set to above zero. Any way to get it to include zero as well?
You can consider any value to be your default comparable value. this can be something that you never expect to happen. and then filter that out in your visual filter
Cheers
Reza
Many thanks for this article. I working on similar report for many days, using excel and power pivot, and I can’t solve it.
In your article you are applying a filter over a visual, how can I do the filter in power pivot?
My data model is like following:
DimPartnerCategory (n — 1) DimParner (1 — n) FactInvoice
My report should show the sales amount for partners belonging to a selected category in a slicer.
Currently my pivot shows ever all partners and it hasn’t take into account the selected category.
Many thanks in advance.
Hi Santiago
can’t you add the measure as a filter in PivotTable or PivotChart? I’m not the best to answer Excel questions, but I guess if that works, that can be your solution.
Cheers
Reza
if i use date table as one dimension and trying to filter other dimension ,it works with vertical list style in slicer option doesn’t work with between option why is that ?
If you mean the type of slicer, you can click on the slicer and change it in the settings to be a BETWEEN slicer