
Parent-child functions in DAX are very useful for parsing an organizational hierarchy or something like a chart of accounts. Usually, for hierarchies that the number of levels is not determined, you need to use a different method, and parent-child functions in DAX are a big help for that type of hierarchies. In this post, you will learn what functions are involved in this class of functions, and how to use it to parse an organizational chart. The same method can be used for a chart of accounts. If you want to learn more about Power BI, read Power BI book, from Rookie to Rock Star.
Introduction
Organizational chart or chart of accounts are specific types of hierarchy. Because it is not usually clear that how many levels of hierarchy you get, the hierarchy structure is stored in two columns across the table; ID, and Parent ID. ID usually points to the existing row as the unique key, and Parent ID usually points to another row in the same table as the ID of manager, or parent, or higher level’s member. Only these two columns together build the hierarchy. Here is an example;

DAX has a set of functions named as Parent-child functions very useful for parsing this type of hierarchy. Let’s see how these functions work.
Sample Dataset
If you want to walk through the example of this post, create a new Power BI Desktop file, and get data from AdventureWorksDW and select DimEmployee as the only table to get data from. Here is how to access the AdventureWorksDW dataset;
Path Function: Finding the entire path from one member
The first function is named as Path. This function gets two parameters; ID and Parent ID. The Path is a very simple function to use. You need to create a calculated column with this function with the code below;
Path = PATH(DimEmployee[EmployeeKey],DimEmployee[ParentEmployeeKey])
Here is the result;

As you can see the output column has all the hierarchy from the current member. The first record’s data means: the current record’s ID is 1, the manager of that is the record with ID of 18, and manager of that is the record with ID of 23, and then the top-level manager is 112. You can see 112 is the top level manager in all records as well.
Finding the Length of Path; PathLength Function
Your next step is to find out how many levels of management you have in the hierarchy. You can use PathLength Function to find out the count of levels for each row. Create a calculated column with PathLength function. This function gets the result of Path function as the input, so you can use the column created in the previous step as the input of this function.
Path Length = PATHLENGTH(DimEmployee[Path])
Here is the result;

To find out the size of hierarchy, you need to find out the maximum PathLength value. You can create a report visual, and show Maximum of Path Length field there to see what is the maximum number of levels in your dataset.

As you can see, the maximum number of levels in the dataset of the example in this blog post is 5.
PathItem; Finding specific levels of the hierarchy
The next step is to create a column for each level of the hierarchy. Using PathItem, you can find out the item for each level of the hierarchy. PathItem gets three parameters;
- The output of the Path function; which we can use our Path calculated column for it.
- The position of the item. Starting from 1, 1 means the highest level (big boss in organizational hierarchy 😉 )
- The output’s data type. 1 means number, 0 means text. We need a number output (to search the employeekey in the table based on that later on), so we use 1 as the input here.
The code will be a calculated column as below;
Organization Level 1 = PATHITEM(
                            DimEmployee[Path],
                            1,
                            1)
Here is the sample output;

As you can see 112 is the ID of the big boss and the first level of management in the Path column.
PathItemReverse; start from the lowest level
If you don’t want to start from the highest level, then you can use the PathItemReverse function. Everything will be similar to using the PathItem function; the only difference is that this time, the position starts with index 1 for the lowest level of the hierarchy.
LookupValue; to find the name of the employee
Having just ID of the manager is not usually enough. You may need to get the name of the employee too. In the DimEmployee table, we do not have a full name field. So first add a full name field as below;

Now you can use the LookupValue function to get the full name of the employee that we found by PathItem function. LookupValue asks for three parameters;
- The output column
- The column to search into for the keyword
- the keyword (keyword in our scenario is coming from the result of the PathItem function)
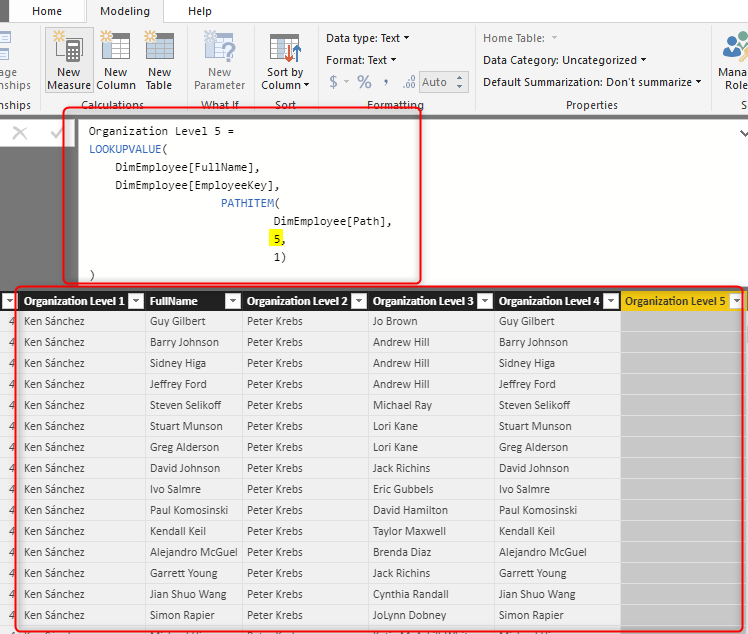
Here is the code altogether for organization level 1:
Organization Level 1 =
LOOKUPVALUE(
    DimEmployee[FullName],
    DimEmployee[EmployeeKey],
                    PATHITEM(
                            DimEmployee[Path],
                            1,
                            1)
)
and the result is as below;

Create one column per hierarchy levels
Finally, you need to create one column per hierarchy level. All you need to do is to copy the code for PathItem and LookupValue and only change the position parameter of that. Here is the final result for five levels;
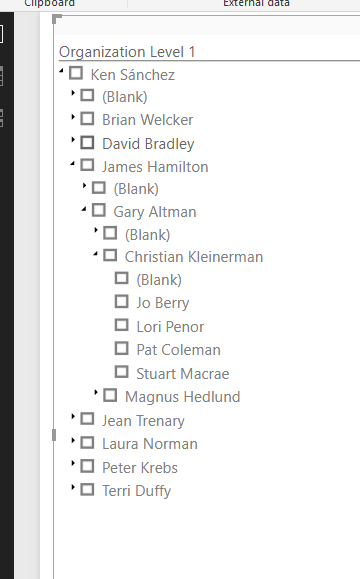
You can then visualize this data using any visuals, but hierarchy slicer custom visual provides a nice output like below, and it acts like a slicer too;
PathContains
We talked about all Parent-child functions in this example, except PathContains. PathContains is a function that searches through a path for an ID. One example usage of this function is to apply dynamic Row Level Security for an organizational chart. Here in this post, I wrote a full example of using the PathContains function for RLS.
Summary
Parent-child functions in DAX are simple to use but very powerful and functional in Power BI and DAX. Using these functions will give you the ability to parse hierarchies such as organizational chart or chart of accounts in a recursive mode. In this post, you have seen an example of using parent-child functions for parsing an organizational chart.


Reza is author of more than 14 books on Microsoft Business Intelligence, most of these books are published under Power BI category. Among these are books such as Power BI DAX Simplified, Pro Power BI Architecture, Power BI from Rookie to Rock Star, Power Query books series, Row-Level Security in Power BI and etc.
He is an International Speaker in Microsoft Ignite, Microsoft Business Applications Summit, Data Insight Summit, PASS Summit, SQL Saturday and SQL user groups. And He is a Microsoft Certified Trainer.
Reza’s passion is to help you find the best data solution, he is Data enthusiast.
His articles on different aspects of technologies, especially on MS BI, can be found on his blog: https://radacad.com/blog.
Nice method, but if you have a lot of hierarchy levels it’s a bit cumbersome, don’t you think? In that case, or maybe in any case, wouldn’t it be better to just self-join the table it concerns? One draw-back, at least in import mode, could be that you duplicate data. But then again, the method of this blog (assuming import mode) would also generate additional data, right? I’m curious about your opinion on this!
Hi Robin.
You can import the table again and create the relationship between those two. however, this will only make it easier for you to go One level up. if you want to go more levels up, you need another table again, or you need to use PATH functions similar to what I explained. The method I explained is only adding new columns, not the entire table for sure. How many levels of hierarchy you are talking about? this is just a one off set up, even if you have ten levels, you just set it up once, and then you can use it.
Cheers
Reza
Hi,
How would you sort a financial accounts type parent child hierarchy in Power BI. Im using a Tabular model as the data source. I have done all the levels etc…thats works fine however the sort is a problem.
regards
Troy
For sorting, you always need two columns; label column (which is your current column), and value column (which is the numeric value that is unique per each text label in the label column and has the sort order in it). in this scenario, you have to have a value column for each level of the hierarchy. I have written a blog post and published a video on how to sort a column based on another column.
Hi Reza, could you please send me the link that you mentioned above? Will this assist me in sorting a 9 level financial ragged hierarchy?
Regards
Troy
This is the video that shows how you can sort one column based on another column
Cheers
Reza
Thanks Reza. This is gold. I’m connecting to a MS Project synced sharepoint online site and this DAX enabled me to rebuild the task levels.
Thanks Richard for sharing your scenario. It is always good to know other scenarios that this can be applied to.
Hi Richard i m trying to do the same for another tool like Ms Project but exactly the same principle .How did you deal with an unknown hierarchy depth. Really be interested in seeing your solution. Or at least could you explain a bit more how did you do it ?
Regards
Renaud
Unfortunately Power BI doesn’t understand the unknown levels because it cannot create columns dynamically. You need to consider value as the maximum levels and build columns based on that.
Cheers
Reza
ok reza thanks
Can we show the parent level with the child items in the same column chart? This will help the users to look at the items with their parent in the same chart. Is it possible?
You mean as a Drill/Down option? when you drag the hierarchy of the organization to a visual (like column chart), you have the option to show these values beside each other (concatenate) or separately. this is in visual format options of that axis.
Hi,
Is there any way to create dynamically all leafs. For example you have parent-child-grandchild hierarchy and born grand grand child , automatically add that leaf.
Hi Sunny.
Unfortunately, you cannot create calculated columns dynamically. That part needs to be done statically. however, there are always quantified number of levels you can go down. There is no unlimited organizational hierarchy 🙂
Cheers
Reza
Awesome article, Reza
Hi Reza,
This is a great write up. I am finding, though, going 10 levels deep that the Hierarchy slicer is being a little performance bottleneck. Is there any way you can think of to improve the performance of a slicer like this?
Unfortunately, we don’t know how this visual is written or working.
I would suggest using Matrix visual in scenarios that hierarchy slicer is slow. if you use the +/- option in the Matrix visual, it really looks like a hierarchy slicer too 🙂
Hi
I have a question here . I am trying to sort the level of the account for 9 levels in excel
I have a parent column with parent accounts and a column with all the accounts as child. Is there a recursive function in excel to do this.
I used INDEX function , however at each level there are different number of accounts related to parents.
sometimes parent has one child, in other times parent has 20 child accounts. the child accounts also has sub accounts and the level continues. in other instances after one child account there is no level.
Hi Raj
Why you are not using the same approach using Power Pivot in Excel? you can use these DAX functions there too.
Cheers
Reza
This (PATH) errors out when children that have multiple parents. I am using it on a Bill-Of-Material hierarchy where 2 different items (parent) can be made out of same 1 item (component). Any suggestions how to make it work under this situation?
Hi Jacob
I guess you are using it in the wrong direction? if two different items can be made out of the same item, then item, then the first item is parent, and the other two are children. am I right? what happens if you replace the ID and parentID in your path function call?
Cheers
Reza
This is really good info!We have one scenario like below.
Path functions does not work when you connect to Hana Direct Query.
Our requirement is to calculated % for this measure Measure= (Sales of Child Node/Sales of Parent Node)*100
we are using matrix table to show expand/collapse,Is there way to handle this scenario in PBI Desktop?
Hi PK
There are two sides in your questions:
1. if path functions doesn’t work for your DQ solution, then the flattening of hierarchy should be done through the script that you can write for your DQ source. for example, for SQL Server, you can use CTE recursive queries.
2. if you want to calculate totals and percentages, check out my article here.
Cheers
Reza
I have done this in SSAS but wanted to do it in Power BI as it uses a SSAS engine anyway. Am I missing something but I cant create any of these columns in Power BI as none of the parent child functions exist?
Regards
Gavin
Hi Gavin
You should be able to do all of these in Power BI, unless you are using Power BI as Live connection. Live connection at the moment have the limitation of creating calculated columns. for the live connection, all of these should be done in SSAS.
Cheers
Reza
Hi Reza,
Is there any way to not display the “Blank” in the hierarchy drill down?
Thanks,
Frederik
Hi Frederik,
I explained in another post, how to get rid of those blanks.
Cheers
Reza
Hi, is it possible to automate the last step? I have a situation where the levels in hierarchy can be dynamic. So, is it possible to make the creation of columns for each level dynamic? Thanks.
Unfortunately the calculated column creation is not possible to be dynamic. not now, it might change in the future, like everything else in the world of Power BI 🙂
Cheers
Reza
Hi, my hierarchy consists of 3,000+ nodes and I’m trying to build a visual that shows the full path of a single node in the graph. The idea is we would use a filter to select the node(s) we’re interested in and the visual would display all the nodes above and below the selected node. I’m using Hierarchy Chart by Akvelon as my visual. Thanks!
Hi Steve
I haven’t worked with the third party visual you mentioned.
However, you can write a DAX measure that returns a value by the selection of your slicer. then use that to filter the visual that you show the hierarchy on it.
Cheers
Reza