
Bookmark is a helpful feature in Power BI. It enables you to have a good story to tell and also have a dynamic visualization. I have explained how bookmarks work in Power BI and how to use them with buttons to have a next-level visualization. An important attribute of the bookmark is the Data. You can choose to have a bookmark with DATA or without. The choice will make a big difference in what you want to do. In this blog and video, I’ll take you through that in detail.
Video
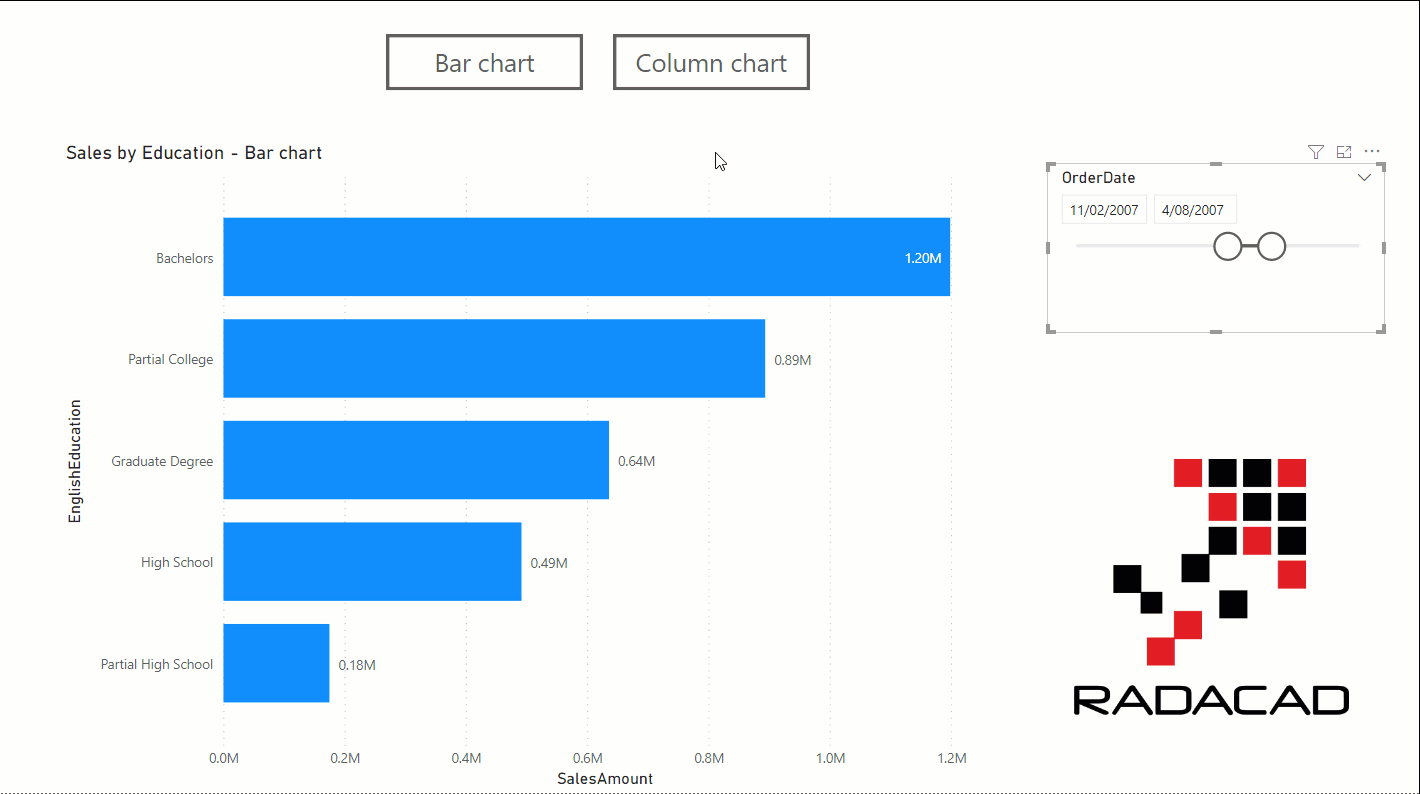
A sample report with bookmarks
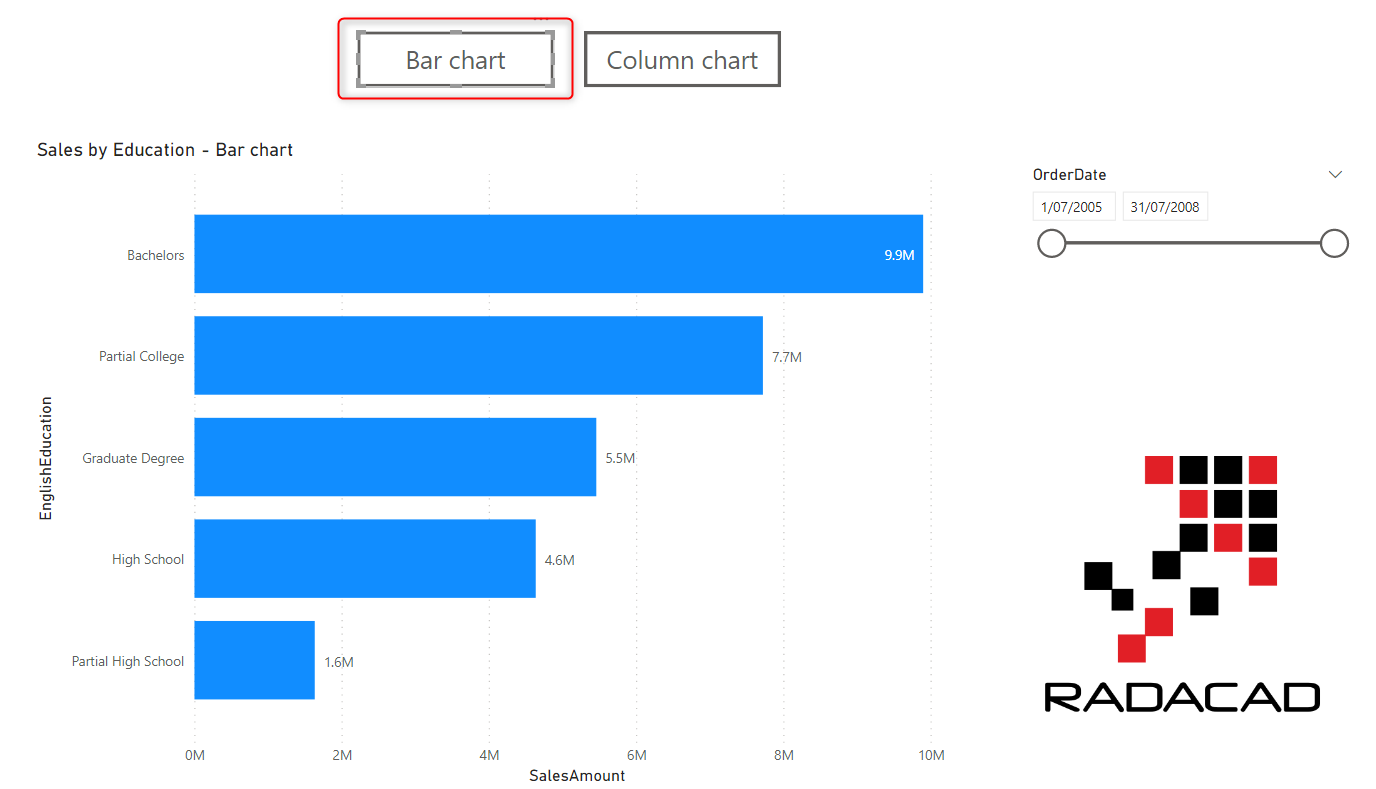
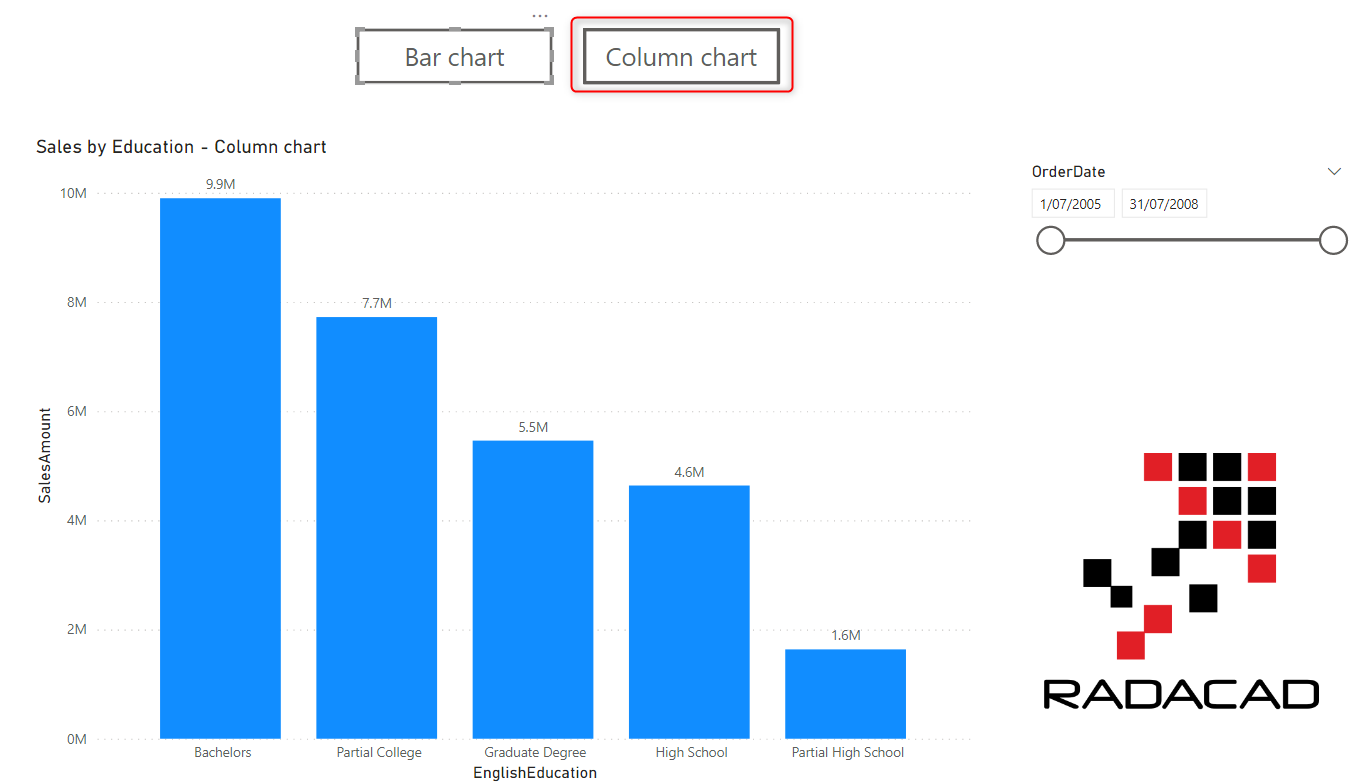
I have a sample Power BI report with a couple of bookmarks. In my report, bookmarks are used to switch between two different visuals. The user can click on the “Bar chart” or “Column chart” on the same report page and dynamically toggle the chart’s type.
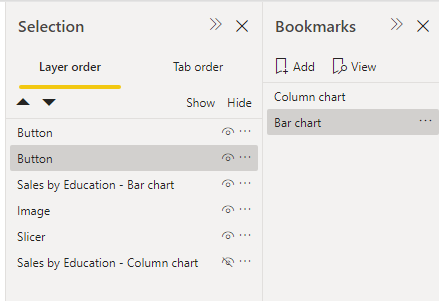
The process above is achieved by using bookmarks, the selection pane, and buttons. I have explained how to do something similar to that here in this article.
Here is the setup in short;
I have two charts overlayed over each other (column chart and bar chart) and two bookmarks created. One is for when the bar chart is hidden, and the other one is when the column chart is hidden. Then I have two buttons that their action is set to these bookmarks respectively.
The above configuration works well. When the user clicks on the column chart, they will see the column chart, and when they click on the bar chart will see the bar chart.
Bookmark with Data
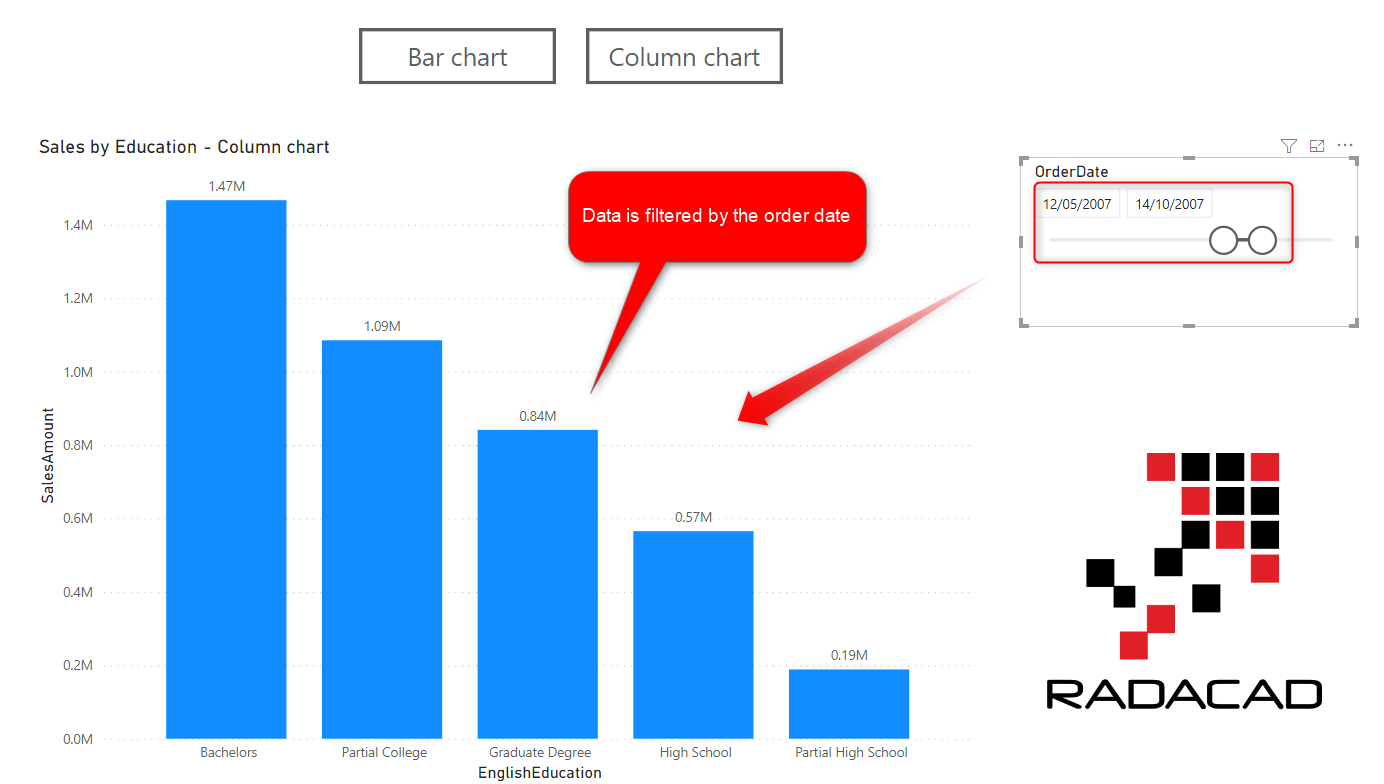
Bookmarks, by default, include data. That means when you create the bookmark, the selection of data values at that time will be saved as part of the bookmark. For example, if you select the period of 2008 in the order date slicer and then create the bookmark, the bookmark will always get you to that period. If you don’t select anything on the date slicer and then create the bookmark, then the bookmark always shows you the unfiltered data.
Let’s see that through our sample report;
If I select a range of dates in the slicer, the data gets filtered;
If I click on a button (which triggers a bookmark) to change the chart type to bar chart, then the selection of dates changes back to the entire period;
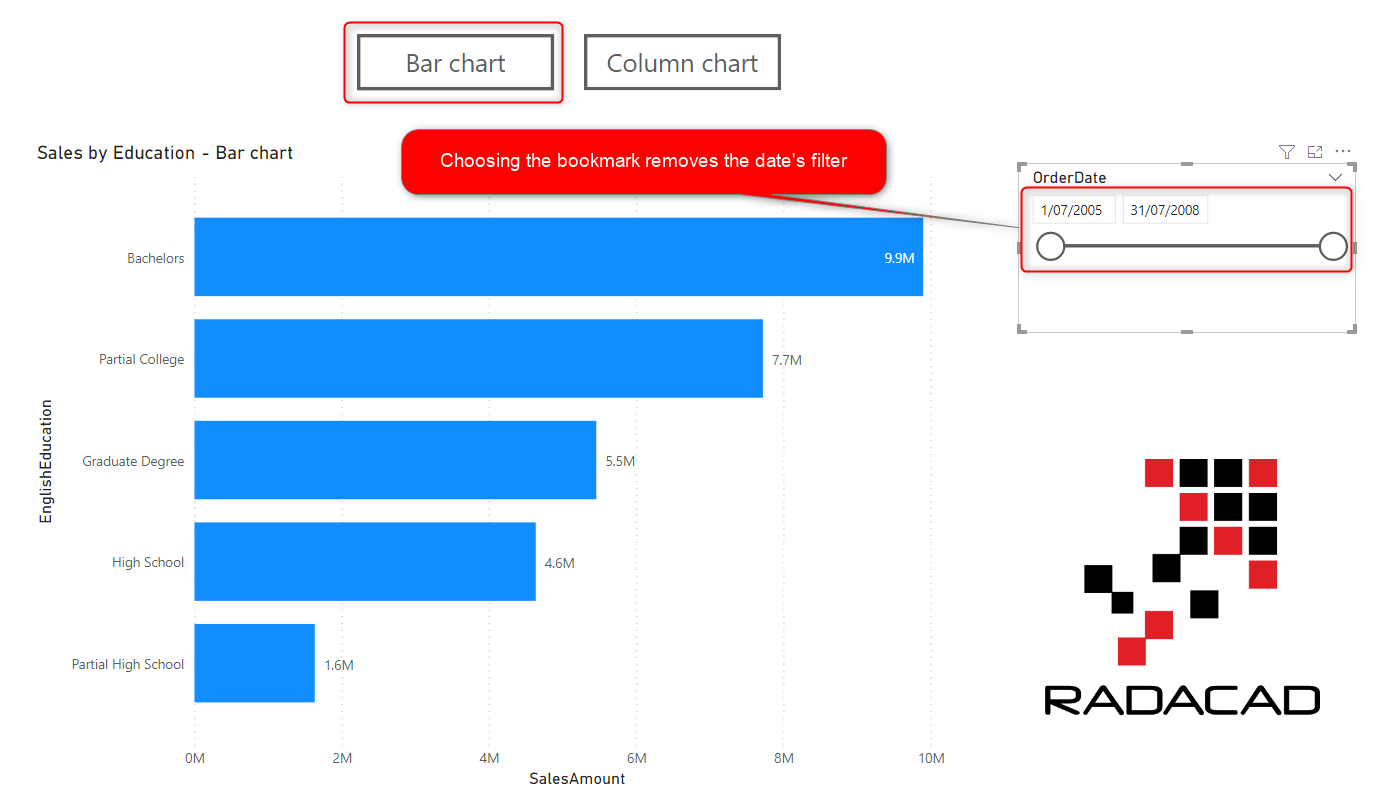
How did this happen? At the time of creating the bookmark, the date slicer’s value was the entire period. This means whenever you use that bookmark, no matter what you selected in the slicer, the bookmark gets you back to the entire period. I have used this method once to explain a trick about how to clear all slicers in the Power BI report using a bookmark.
You can click on the … besides the bookmark and see that the Data is by default selected.
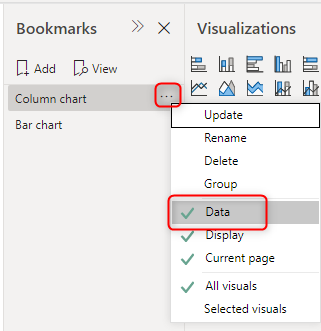
The bookmark with data means that the selection of slicers will be saved as the page’s status, and the bookmark always gets you back to that status.
In our sample report in this article, It is not good to have it bookmark with data because this means every time I change the chart type (change the bookmark), I have to re-select values in the slicers. Let’s see what bookmark without data means, then.
Bookmark without data
If you want the bookmark to only toggle visualization, change page navigations, etc., and you want the current selection of slicers not to get back to default (or any state that you created a bookmark for it), you need a bookmark without data.
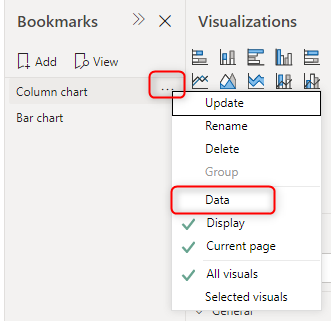
To remove the Data from the bookmark, all you need to do is click on the … besides the bookmark’s name and uncheck the data.
Once I do this for the two bookmarks in my report, I can now easily switch between the two types of charts (two bookmarks) without losing the selection of values in the slicer;
In my example report here, I get more benefit from using bookmarks without data. However, there are samples that you get to benefit from bookmark with data, such as the scenario for clear all slicers or focusing on a specific part of the data for storytelling using bookmarks.
Summary
Bookmark is a useful feature in taking your Power BI visualization to the next level. However, depending on the scenario you are implementing, you have to choose to use bookmark with or without data. If your goal is visual or page navigation without concern about specific data points, then a bookmark without data is a better option for you. However, a bookmark with data works better if you want to point to specific data points using a selection of slicers to tell a story.
I also recommend reading the two other articles below related to bookmarks in Power BI;
- Clear All Slicers in Power BI; A Bookmark Story
- Bookmarks and Buttons: Making Power BI Charts Even More Interactive
Download Sample Power BI File
Download the sample Power BI report here:


Reza is author of more than 14 books on Microsoft Business Intelligence, most of these books are published under Power BI category. Among these are books such as Power BI DAX Simplified, Pro Power BI Architecture, Power BI from Rookie to Rock Star, Power Query books series, Row-Level Security in Power BI and etc.
He is an International Speaker in Microsoft Ignite, Microsoft Business Applications Summit, Data Insight Summit, PASS Summit, SQL Saturday and SQL user groups. And He is a Microsoft Certified Trainer.
Reza’s passion is to help you find the best data solution, he is Data enthusiast.
His articles on different aspects of technologies, especially on MS BI, can be found on his blog: https://radacad.com/blog.