
In this and next post, I am going to show you how to connect to SQL Server to get data from there, then create a table chart using ggplot2 package inside SQL Server 2017 and then show the chart in SSRS.
there are multiple steps for that we need to follow
Get data and create code in R studio
- load data from SQL Server into R studio
- create the chart in R studio and check the code there
Create Store Procedure to create Chart in SQL Server 2017
- create a stored procedure to create a facet chart
- Store chart in a table as a binary variable
Create a report in SSRS
- create a data connection to a database
- create a report to show the R chart
Get data and create code in R studio
there is a hello database name “AdventureWorks” for SQL people. you able to get the database from https://www.microsoft.com/en-us/download/details.aspx?id=49502
I want to create a chart first in R studio. This will help me to check the R code and be sure the code works. To do that I need to access this database. For now, I have this database on my local SQL Server 2017.
to access the data I am going to use a famous R package name “RODBC”
this package has a function name “odbcDriverConnect” which create a connection string. It gets some information such as the driver, server, database name and so forth.
library(RODBC)
DBHANDLE<-odbcDriverConnect('driver={SQL Server};server=localhost\\ML2017;database=AdventureworksDW2016CTP3;trusted_connection=true')
NOTE: for the server instead of “.” use localhost and “\” you need to add “\\” so not used the .\ML2017 just use localhost\\ML2017
also, there is a function available in RODBC name sqlQuery that allows you to write the SQL statement to fetch desired data.
fileds<-sqlQuery(DBHANDLE,'select Color,Size,class,TaxAmt,SalesAmount
from [dbo].[FactInternetSales] FIS inner join
[dbo].[DimProduct] DP on FIS.ProductKey=dp.ProductKey')
as you see in above code, I pass the connection information that has been stored in DBHANDLE variable. the second argument is the related query that is in SQL language.
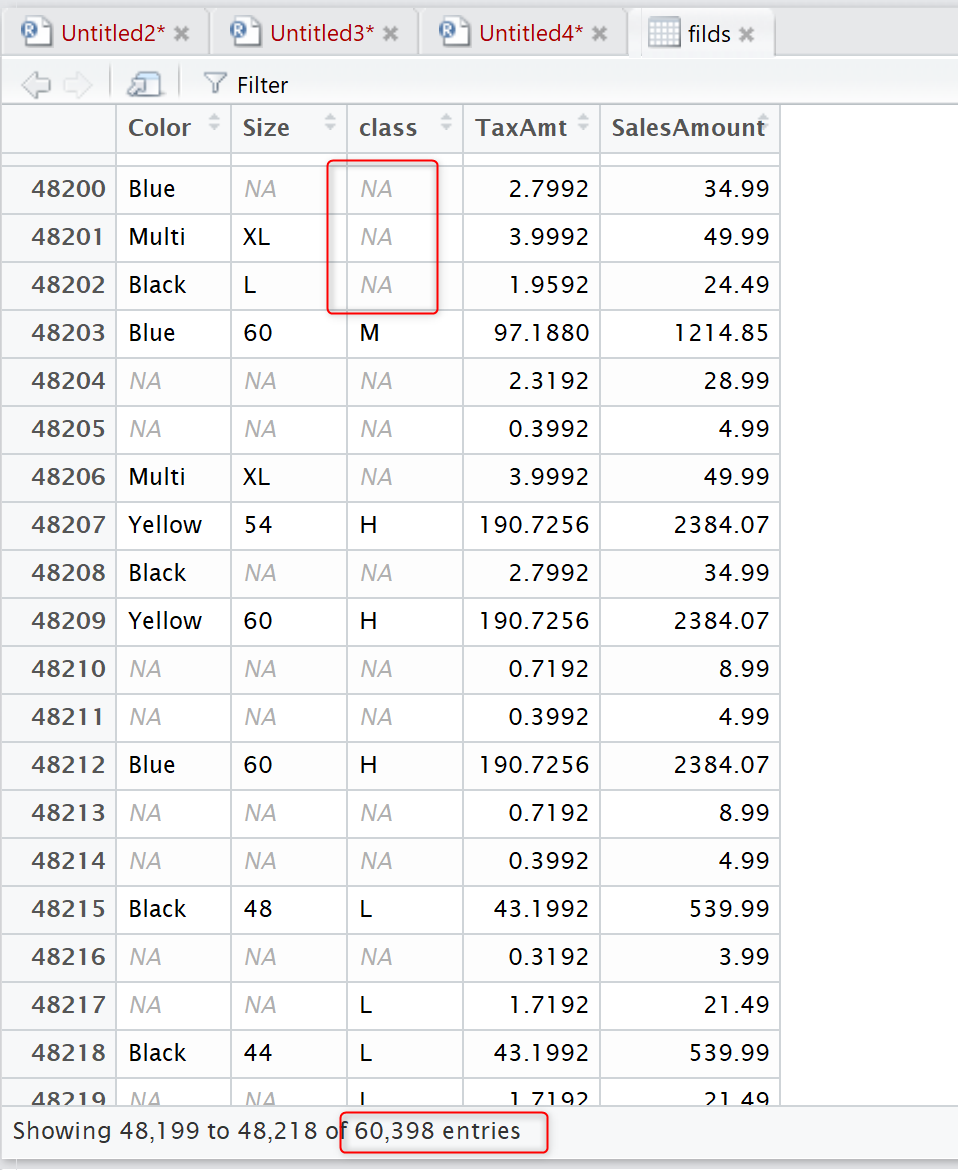
just check the fields variable. using View(fields ).
almost 60198 rows have been loaded in one second into R variable!
to draw a chart, first, I need to remove the “NA” data from the fields variable.
the code for that is
filds<- na.omit(filds)
nrow(filds)
now we have 15205 rows instead, that shows the other rows have NA values that have been removed.
Now data is ready to draw a table chart with the subplot of as a boxplot
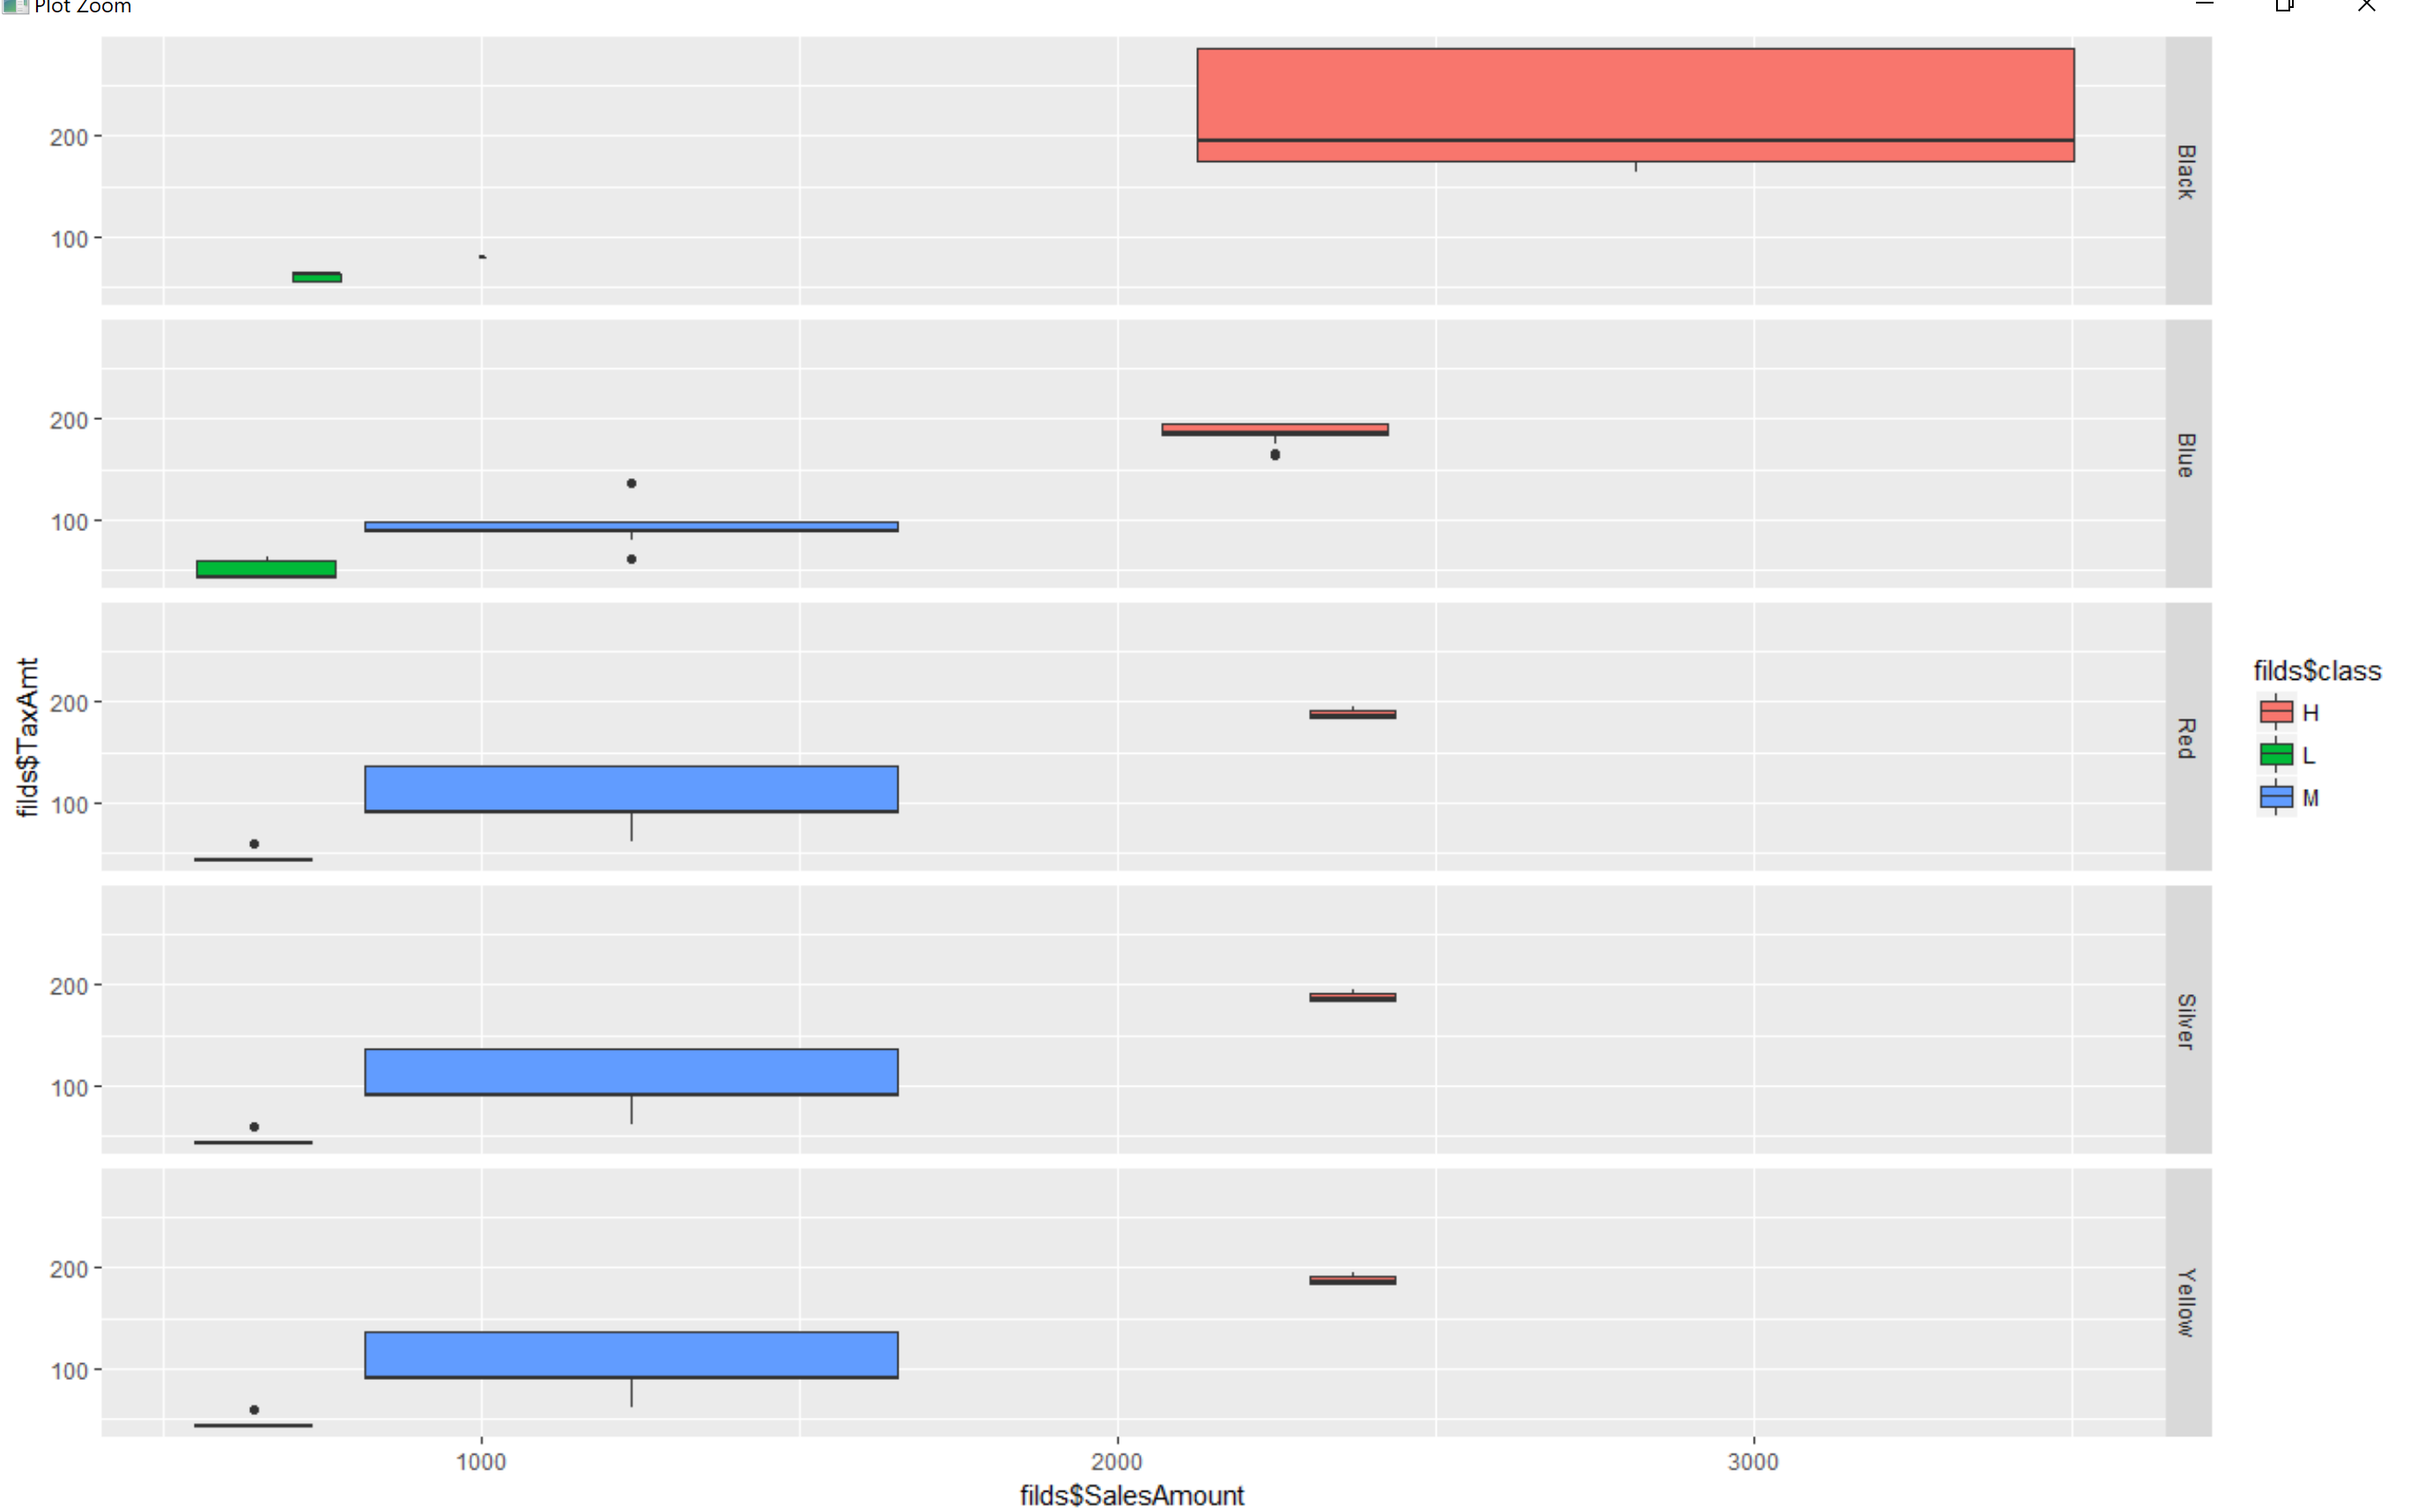
library(ggplot2)
ggplot(filds,aes(x=filds$SalesAmount,y=filds$TaxAmt,color=factor(filds$class)))+geom_boxplot()+facet_grid(filds$Color~.)
the chart will be as below:
it shows a boxplot for sales amount by creating a table that shows the color of each product as row and the class of each product as a legend.
In the next post I will show how to show this chart in SSRS by running the same R code in SQL Server 2017.


