
I have a Power Query script that I usually use in any Power BI solution that needs time-based analysis. However, I never had a chance to publish it here for everyone to use. So here it is. A friend’s question about a time table reminded me that it is good to publish this to the public. This is a script that you can simply just copy and paste into your Power BI solution, and get a full Time Table with all columns commonly needed.
Why Time Table?
I have explained about Date Dimension a lot previously and mentioned why that is needed. Date dimension gives you the ability to slice and dice your data by different date attributes, such as year, quarter, month, day, fiscal columns, etc. Time dimension, on the other hand, will give you the ability to slice and dice data in the level of hours, minutes, seconds, and buckets related to that, such as every 30 minutes, or 15 minutes, etc.
Time table SHOULD NOT be combined with Date table, the main reason is the huge size of the combined result. Let’s say your date table which includes one record per day, has 10 years of data in it, which means 3,650 rows. Now if you have a Time table with a row for every second, this ends up with 24*60*60=86,400 rows just for the time table. If you combine date and time table, you will have 3,650*86,400=315,360,000 rows. 315 Million rows in a table are not good for a dimension table. Even if you store one record per minute in your time table, you would still end up with over 5 million rows.
So don’t combine the Date and Time table. These two should be two different tables, and they both can have a relationship to the fact table.
Columns Included in the Time Dimension
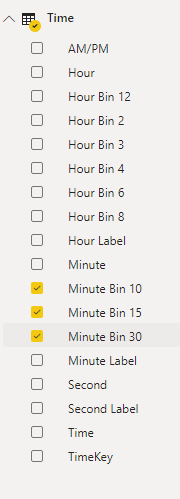
This time dimension (or you might call it a time table) includes all the columns as below;
How to use the Script?
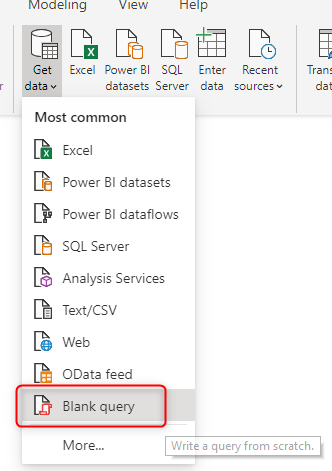
Create a new blank query in Power BI:
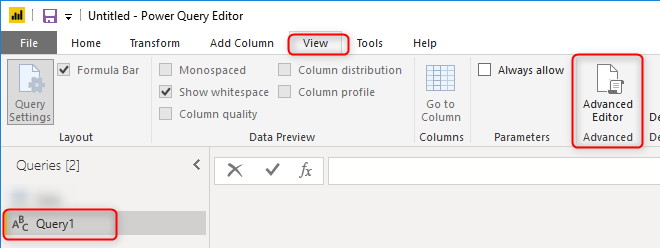
In the Power Query Editor window, go to View tab, and click on Advanced Editor
Copy and Paste the entire script here (replace the existing text in the Advanced Editor window:
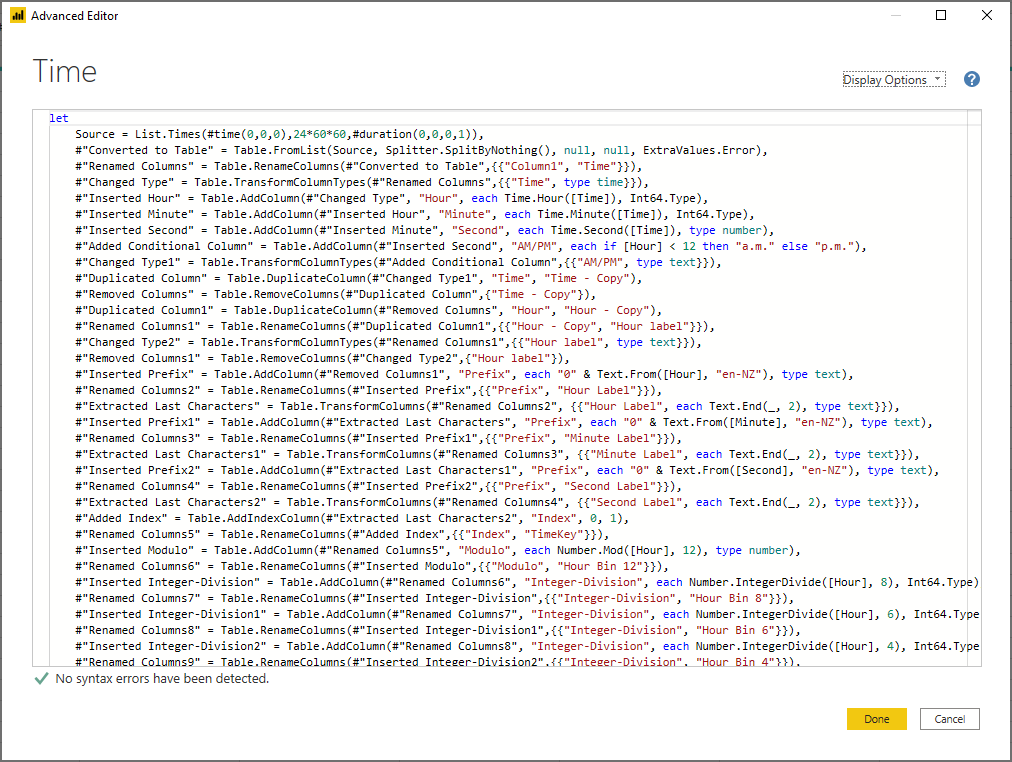
Script
This is the script for the Time dimension:
let
    Source = List.Times(#time(0,0,0),24*60*60,#duration(0,0,0,1)),
    #"Converted to Table" = Table.FromList(Source, Splitter.SplitByNothing(), null, null, ExtraValues.Error),
    #"Renamed Columns" = Table.RenameColumns(#"Converted to Table",{{"Column1", "Time"}}),
    #"Changed Type" = Table.TransformColumnTypes(#"Renamed Columns",{{"Time", type time}}),
    #"Inserted Hour" = Table.AddColumn(#"Changed Type", "Hour", each Time.Hour([Time]), Int64.Type),
    #"Inserted Minute" = Table.AddColumn(#"Inserted Hour", "Minute", each Time.Minute([Time]), Int64.Type),
    #"Inserted Second" = Table.AddColumn(#"Inserted Minute", "Second", each Time.Second([Time]), type number),
    #"Added Conditional Column" = Table.AddColumn(#"Inserted Second", "AM/PM", each if [Hour] < 12 then "a.m." else "p.m."),
    #"Changed Type1" = Table.TransformColumnTypes(#"Added Conditional Column",{{"AM/PM", type text}}),
    #"Duplicated Column" = Table.DuplicateColumn(#"Changed Type1", "Time", "Time - Copy"),
    #"Removed Columns" = Table.RemoveColumns(#"Duplicated Column",{"Time - Copy"}),
    #"Duplicated Column1" = Table.DuplicateColumn(#"Removed Columns", "Hour", "Hour - Copy"),
    #"Renamed Columns1" = Table.RenameColumns(#"Duplicated Column1",{{"Hour - Copy", "Hour label"}}),
    #"Changed Type2" = Table.TransformColumnTypes(#"Renamed Columns1",{{"Hour label", type text}}),
    #"Removed Columns1" = Table.RemoveColumns(#"Changed Type2",{"Hour label"}),
    #"Inserted Prefix" = Table.AddColumn(#"Removed Columns1", "Prefix", each "0" & Text.From([Hour], "en-NZ"), type text),
    #"Renamed Columns2" = Table.RenameColumns(#"Inserted Prefix",{{"Prefix", "Hour Label"}}),
    #"Extracted Last Characters" = Table.TransformColumns(#"Renamed Columns2", {{"Hour Label", each Text.End(_, 2), type text}}),
    #"Inserted Prefix1" = Table.AddColumn(#"Extracted Last Characters", "Prefix", each "0" & Text.From([Minute], "en-NZ"), type text),
    #"Renamed Columns3" = Table.RenameColumns(#"Inserted Prefix1",{{"Prefix", "Minute Label"}}),
    #"Extracted Last Characters1" = Table.TransformColumns(#"Renamed Columns3", {{"Minute Label", each Text.End(_, 2), type text}}),
    #"Inserted Prefix2" = Table.AddColumn(#"Extracted Last Characters1", "Prefix", each "0" & Text.From([Second], "en-NZ"), type text),
    #"Renamed Columns4" = Table.RenameColumns(#"Inserted Prefix2",{{"Prefix", "Second Label"}}),
    #"Extracted Last Characters2" = Table.TransformColumns(#"Renamed Columns4", {{"Second Label", each Text.End(_, 2), type text}}),
    #"Added Index" = Table.AddIndexColumn(#"Extracted Last Characters2", "Index", 0, 1),
    #"Renamed Columns5" = Table.RenameColumns(#"Added Index",{{"Index", "TimeKey"}}),
    #"Inserted Modulo" = Table.AddColumn(#"Renamed Columns5", "Modulo", each Number.Mod([Hour], 12), type number),
    #"Renamed Columns6" = Table.RenameColumns(#"Inserted Modulo",{{"Modulo", "Hour Bin 12"}}),
    #"Inserted Integer-Division" = Table.AddColumn(#"Renamed Columns6", "Integer-Division", each Number.IntegerDivide([Hour], 8), Int64.Type),
    #"Renamed Columns7" = Table.RenameColumns(#"Inserted Integer-Division",{{"Integer-Division", "Hour Bin 8"}}),
    #"Inserted Integer-Division1" = Table.AddColumn(#"Renamed Columns7", "Integer-Division", each Number.IntegerDivide([Hour], 6), Int64.Type),
    #"Renamed Columns8" = Table.RenameColumns(#"Inserted Integer-Division1",{{"Integer-Division", "Hour Bin 6"}}),
    #"Inserted Integer-Division2" = Table.AddColumn(#"Renamed Columns8", "Integer-Division", each Number.IntegerDivide([Hour], 4), Int64.Type),
    #"Renamed Columns9" = Table.RenameColumns(#"Inserted Integer-Division2",{{"Integer-Division", "Hour Bin 4"}}),
    #"Inserted Integer-Division3" = Table.AddColumn(#"Renamed Columns9", "Integer-Division", each Number.IntegerDivide([Hour], 3), Int64.Type),
    #"Renamed Columns10" = Table.RenameColumns(#"Inserted Integer-Division3",{{"Integer-Division", "Hour Bin 3"}}),
    #"Inserted Integer-Division4" = Table.AddColumn(#"Renamed Columns10", "Integer-Division", each Number.IntegerDivide([Hour], 2), Int64.Type),
    #"Renamed Columns11" = Table.RenameColumns(#"Inserted Integer-Division4",{{"Integer-Division", "Hour Bin 2"}}),
    #"Inserted Integer-Division5" = Table.AddColumn(#"Renamed Columns11", "Integer-Division", each Number.IntegerDivide([Minute], 30), Int64.Type),
    #"Multiplied Column" = Table.TransformColumns(#"Inserted Integer-Division5", {{"Integer-Division", each _ * 30, type number}}),
    #"Renamed Columns12" = Table.RenameColumns(#"Multiplied Column",{{"Integer-Division", "Minute Bin 30"}}),
    #"Inserted Integer-Division6" = Table.AddColumn(#"Renamed Columns12", "Integer-Division", each Number.IntegerDivide([Minute], 15), Int64.Type),
    #"Multiplied Column1" = Table.TransformColumns(#"Inserted Integer-Division6", {{"Integer-Division", each _ * 15, type number}}),
    #"Renamed Columns13" = Table.RenameColumns(#"Multiplied Column1",{{"Integer-Division", "Minute Bin 15"}}),
    #"Inserted Integer-Division7" = Table.AddColumn(#"Renamed Columns13", "Integer-Division", each Number.IntegerDivide([Minute], 10), Int64.Type),
    #"Multiplied Column2" = Table.TransformColumns(#"Inserted Integer-Division7", {{"Integer-Division", each _ * 10, type number}}),
    #"Renamed Columns14" = Table.RenameColumns(#"Multiplied Column2",{{"Integer-Division", "Minute Bin 10"}})
in
    #"Renamed Columns14"
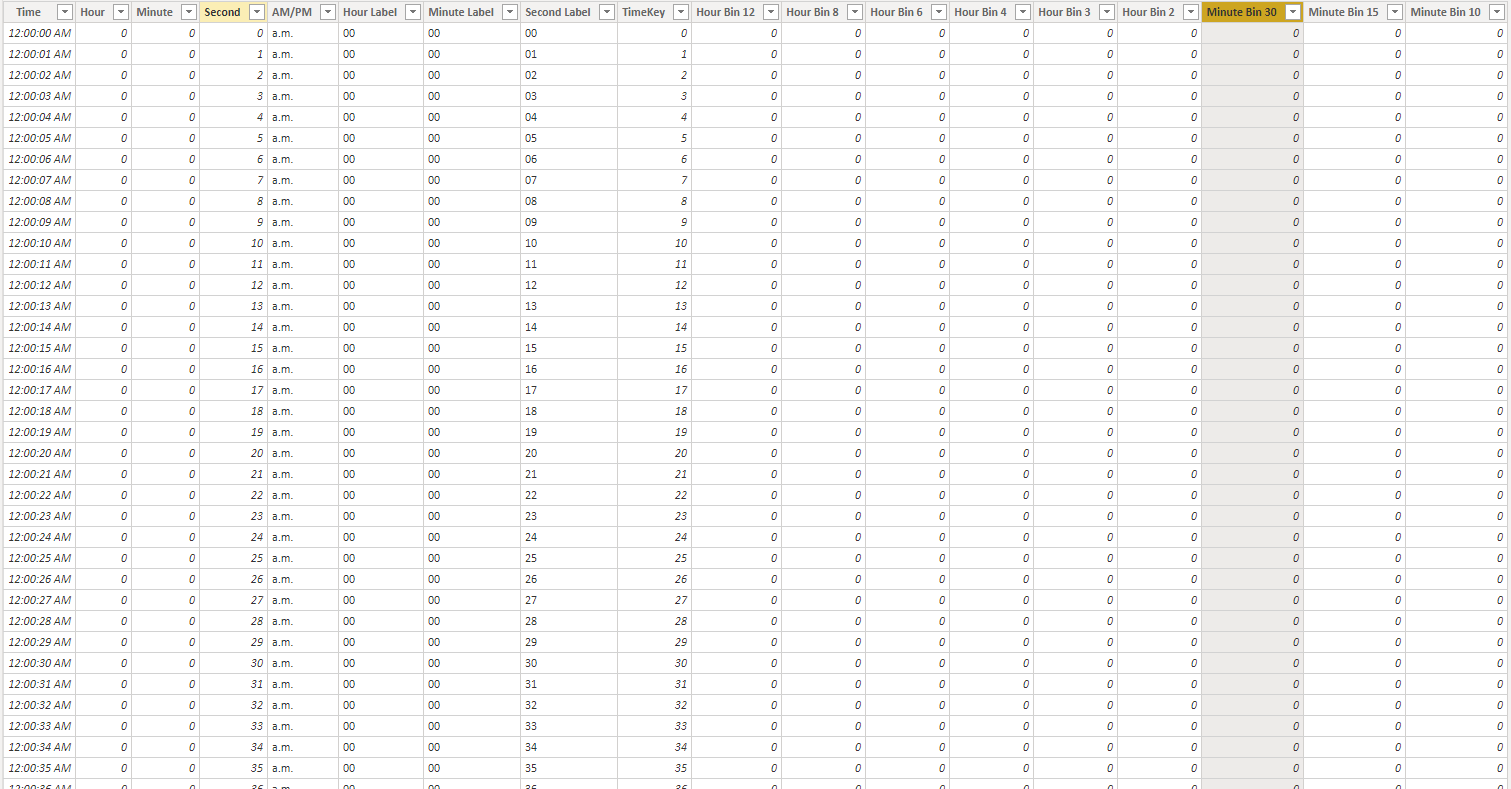
Sample Records
Here are some sample records of this table:
Best Practice Suggestion
Because the Time table is a table that is needed not only in one Power BI file but in many others, I suggest creating a dataflow entity for the Time table. Here in this article, I explained how you can create a dataflow.
Considerations
There are a few things you need to consider if you are using this script;
- This Time dimension is in the grain of a second. Which means the table has one record per second.
- There are some time buckets already created including hour buckets of 12, 8, 6, 4, 3, and 2, and minute buckets of 30, 15, and 10. I will add more buckets into this in the future.
- If you want to use a Date dimension as well, use this script to generate a Date dimension.
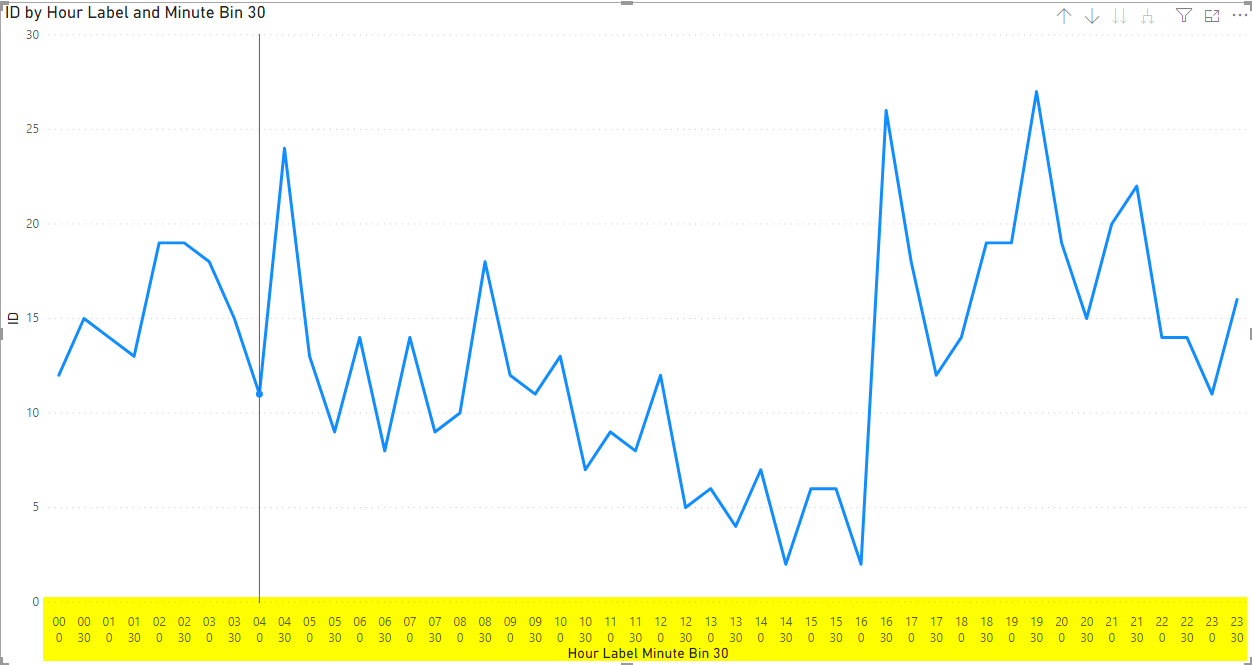
Here is an example of data analyzed by a couple of columns from this Time table;
Video


Reza is author of more than 14 books on Microsoft Business Intelligence, most of these books are published under Power BI category. Among these are books such as Power BI DAX Simplified, Pro Power BI Architecture, Power BI from Rookie to Rock Star, Power Query books series, Row-Level Security in Power BI and etc.
He is an International Speaker in Microsoft Ignite, Microsoft Business Applications Summit, Data Insight Summit, PASS Summit, SQL Saturday and SQL user groups. And He is a Microsoft Certified Trainer.
Reza’s passion is to help you find the best data solution, he is Data enthusiast.
His articles on different aspects of technologies, especially on MS BI, can be found on his blog: https://radacad.com/blog.
The article is awesome.
But this cannot be combined with other direct query queries.
This query will load into PBI in import mode only, making the dataset composite.
The same result with PBI calculated table is more appreciable from Direct query prespective.
Why don’t you want to use Composite Mode?
The composite mode will be definitely a better option that DirectQuery, you don’t need to send a query to the database for your small tables like this Time table
Cheers
Reza
Hi Reza, found this method works well except in a report where datetime is needed in a line chart trend with a continuous X axis otherwise the visual becomes limited to categorical. I had to use a datetime dimension but the size wasn’t factor since the grain was hours minutes without seconds and for limited rolling periods.
Hi Steven
Even if that is a requirement you can have date field, and then time field in the line chart both as axis one after each other (like a hierarchy), and then expand to the next level and it should give you the trend over the date and time
Cheers
Reza
Hi, what is the relationship setup I should setup to use this table? I have a column in my data base that has date and time, but cannot get the chart for todays information. Also I have a date table in my dataset.
Hi Reggie
Here is a blog post that explains it
Cheers
Reza
Hi Reza, how to create a time dimension but only up to minutes, do not include second
Hi Daniel
You can copy the script from this post, and then remove all those steps that generate the Second or Second related columns.
Cheers
Reza
Hi Reza
Thank you for both this time script and the date script to create a comprehensive set master date/time tables.
My issue however is that i have two sets of data both being reported either in minute or second freq over months.
I have brought them into without issue into power query and then into powerbi. In each they have a date/time column which comes with the data which i have then created via duplication in power query a separate date and time column(s) in each data set. These columns i have then created relationships with to the master date and master time tables.
The issue though is when i plot the data using the master date table on the x-axis is i only get one data point for the day which loses a lot of the granularity of the data.
you mention that you do not want to create a a master date/time table for every second of the day as that can create 100’s of millions of lines in that table. So it there a work around that allows me to create a master date/time table into the seconds with out going to large.
Could you point me in the right direction to a resource on this. thanks phil
Hi Phil
do you have a screenshot of your input tables? as generic advice, I suggest the method I explained here
Cheers
Reza
Hello Reza,
I want to link this time to Days. How to achieve that?
thanks
Chintha
Hi
Read my article here about connecting date and time tables in the model
Cheers
Reza
thanks Reza
thanks Reza!