
You can set the color in every visual in Power BI easily. You can also set the color of multiple visuals at the same time using Themes. However, what if you want to set the same color for the same data point? For example, You want the Gender Female to be always colored Orange in all the charts and visuals. In Power BI, as of now, you cannot set a data point color. However, there is an easy solution for that, which I explained in this article and video.
Video
Explaining the Problem: The default behavior
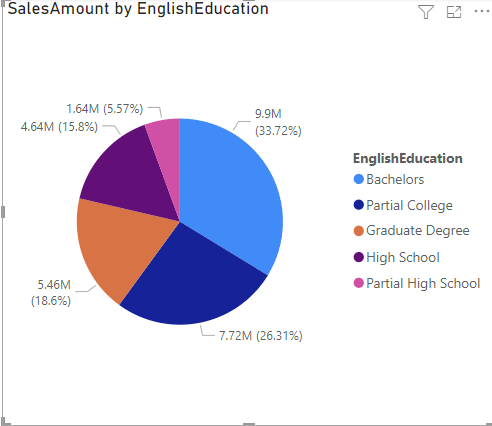
Some charts and visuals in Power BI come with a default set of colors. Examples of these are Pie charts, Donut charts, and treemaps.
Some charts just come with one color, but then you can adjust their color in the Format pane.
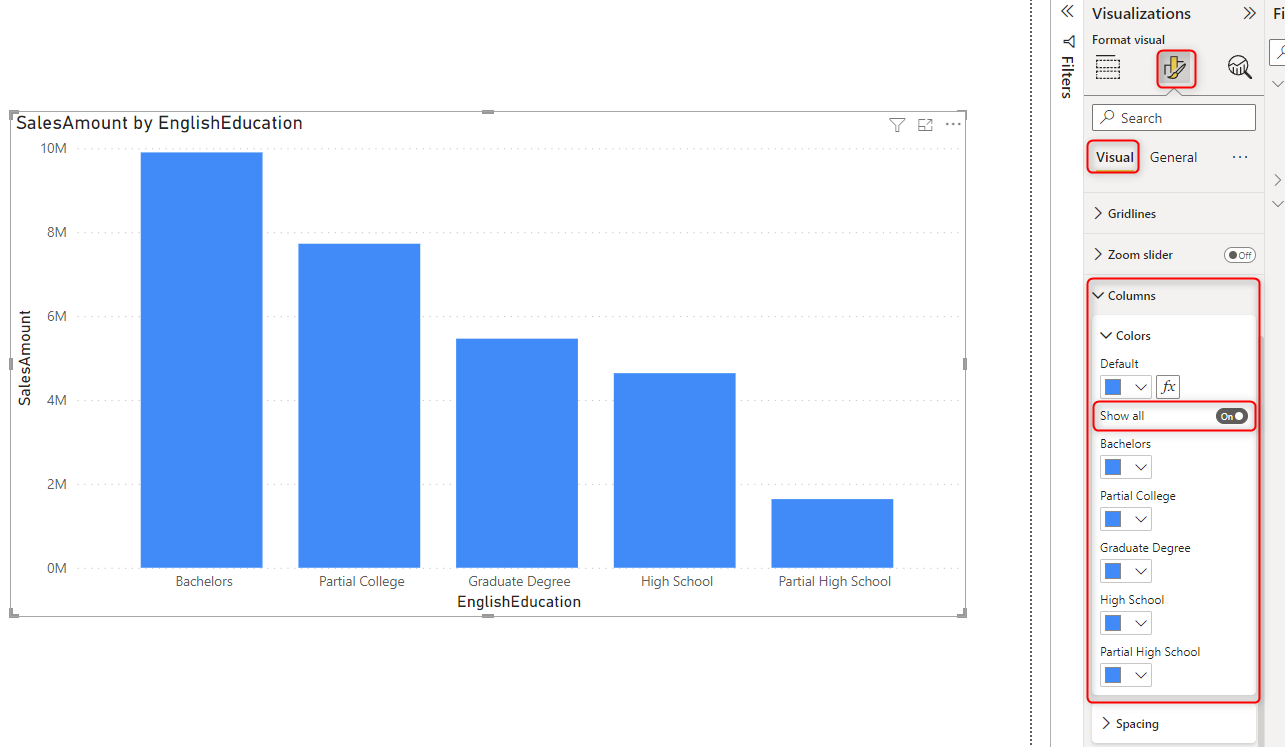
Now if you have more than one chart or visual on a Power BI page, and you want to have the same color for “High School” EnglishEducation for all of them, the only way is to manually set that color in the Format pane (as showed in the above screenshot).
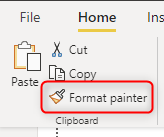
Manually setting a value comes at the cost of maintenance. If you want to change this color, then all visuals have to be changed with this color. Things such as Format Painter help in Power BI. However, if you have many report pages and many visuals on each page, you have to use the format painter for each visual.
Another way to automatically set the color for multiple items is to use a Theme. You can set the color in Theme, However, you cannot set it for specific data points. You cannot, for example, set the color Green for everywhere “High School” is visible in a visual.
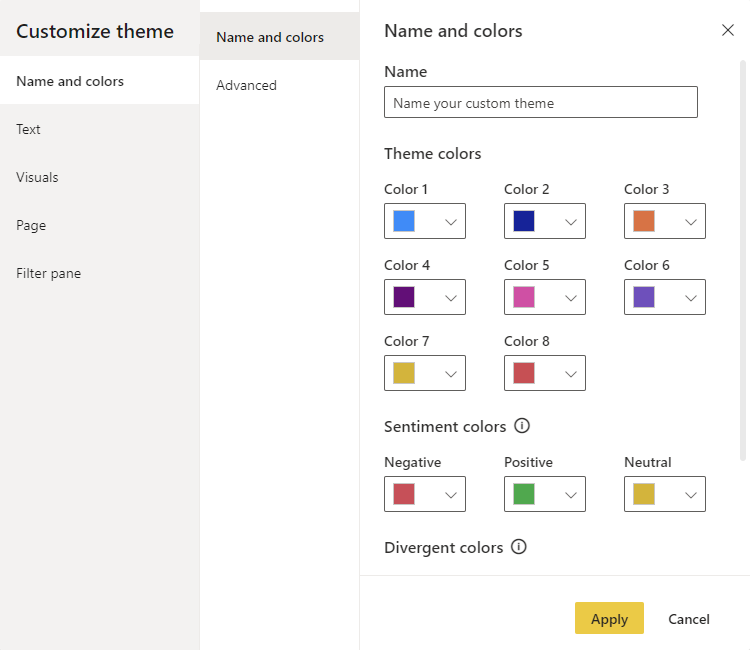
To learn more about Themes in Power BI, read my article here:
So, If you want to set a specific color for a data point, Such as setting Green for “High School” EnglishEducation, You cannot do it using the default functionalities in Power BI (not yet, this function might become available in the future). Now let me explain to you how you can do that using a simple solution.
Color Table
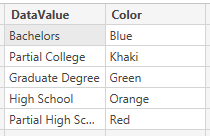
The solution that I am about to show you uses conditional formatting in Power BI. To start, you will need a table with colors for every data point. Something like the below;
This table can be created in many different ways. You can create that in the data source as a table in the database, or in Excel, or you can even create that in Power BI using Enter data;
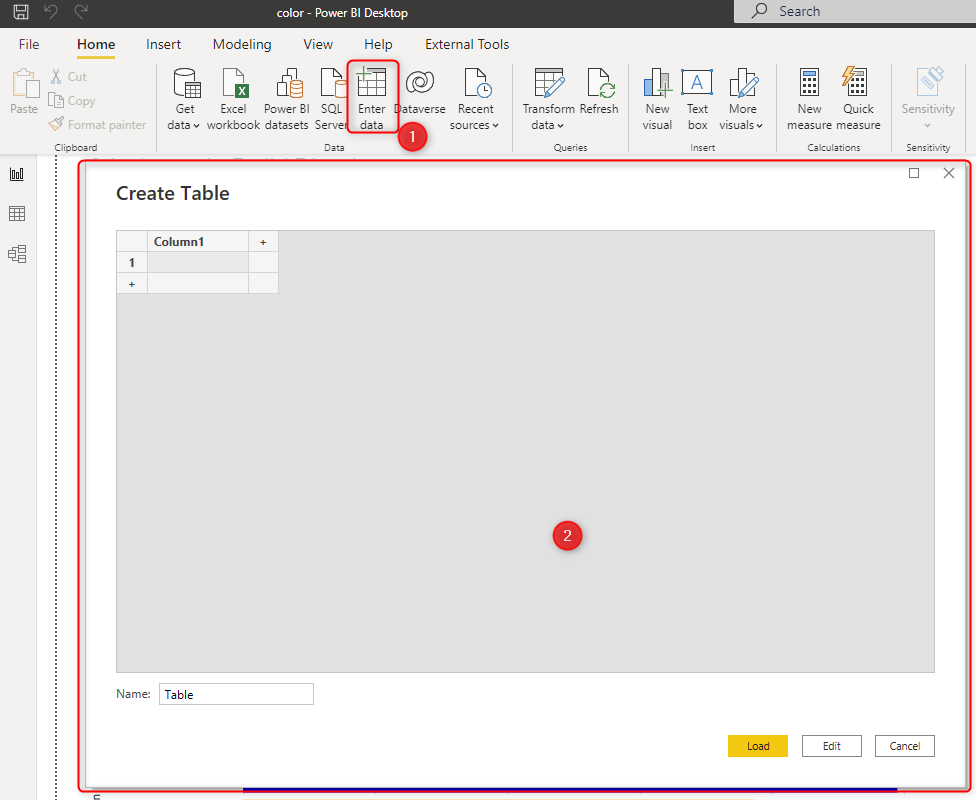
I would recommend the table to be created outside of Power BI because for changing the values, you won’t need to open the PBIX file. For this example, I stick into the Enter Data in Power BI though.
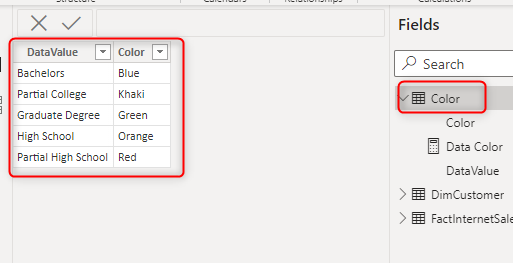
This is the table I created in this example, and I named it Color;
DAX Measure
The second step is to create a measure that can find the color related to each data point. This can be done in two ways. One way is to create a relationship between this table and the DimCustomer (which includes the EnglishEducation). However, if I do that depending on the cardinality of the relationship, I may need to use a both-directional relationship to get it working. As the both-directional relationship might cause some other issues, I use a different approach: Having no relationship between the color table and other tables and using DAX measures for conditional formatting. This pattern is called the Parameter table.
This is the expression I created for the measure named Data Color;
Data Color =
lookupvalue(
    Color[Color],
    Color[DataValue],
    SELECTEDVALUE(DimCustomer[EnglishEducation]),
    "Light blue")
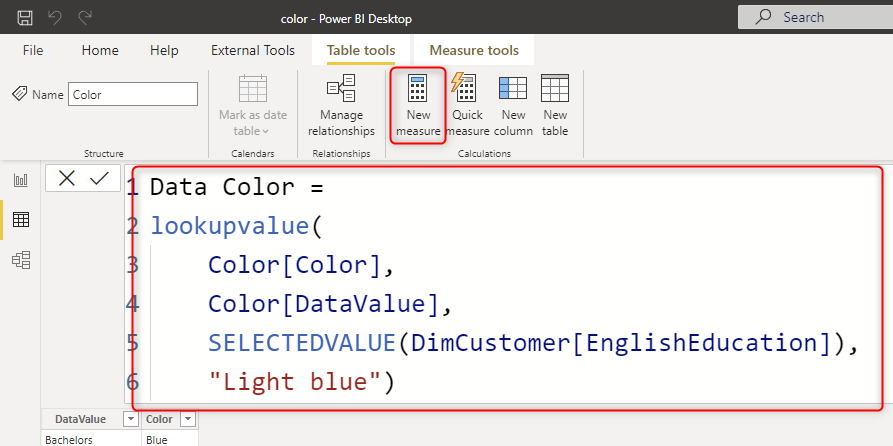
This DAX expression uses the LookupValue function to determine what EnglishEducation is selected in the DimCustomer table and then based on that what is the color related to that in the Color table. In case of no selection, the default color of “light blue” will be used. To learn more about LookupValue, read my article below;
Conditional Formatting for Color
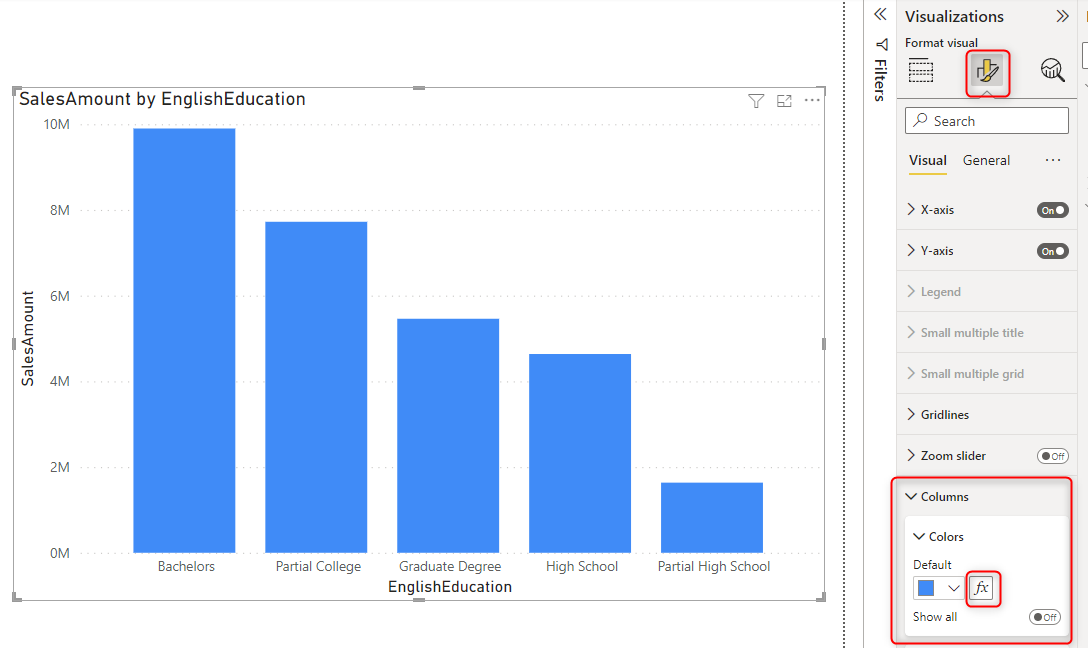
Now the third and final step is to set the color for each visual using the conditional formatting and use the measure we created above. This can be done using the fx (conditional formatting) for the color in the column chart visual for example.
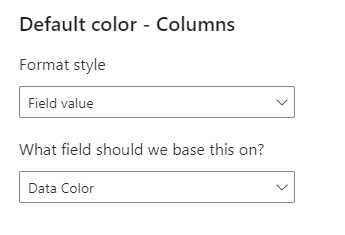
In the conditional formatting settings, choose Format style to “Field Value”, and choose the measure in the “What field should we base this on” as below;
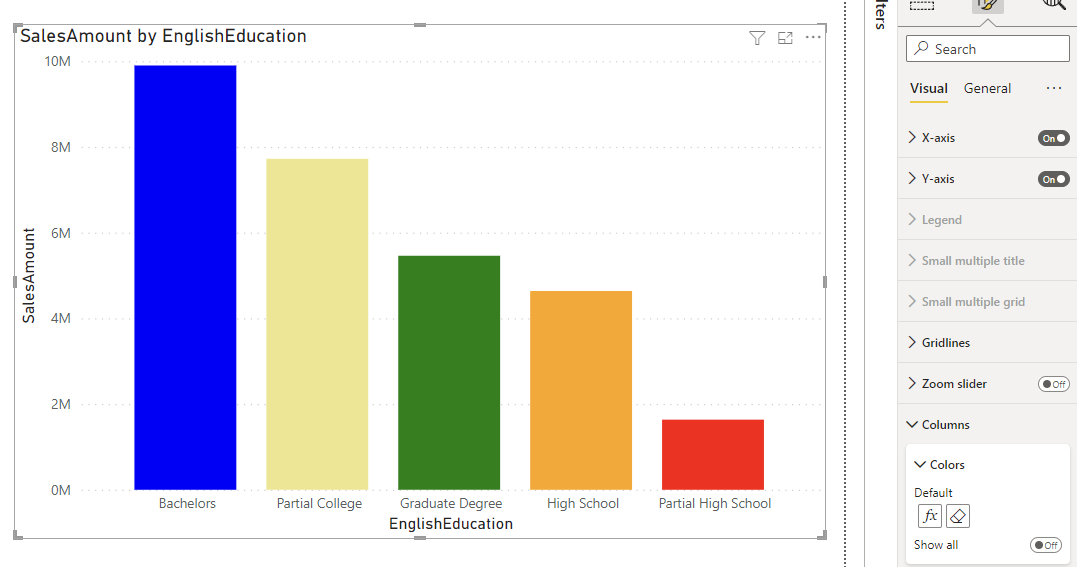
Now the visual should show colors dynamically;
This setting can be done in other visuals as well. You can also get the help of Format Painter to do it faster.
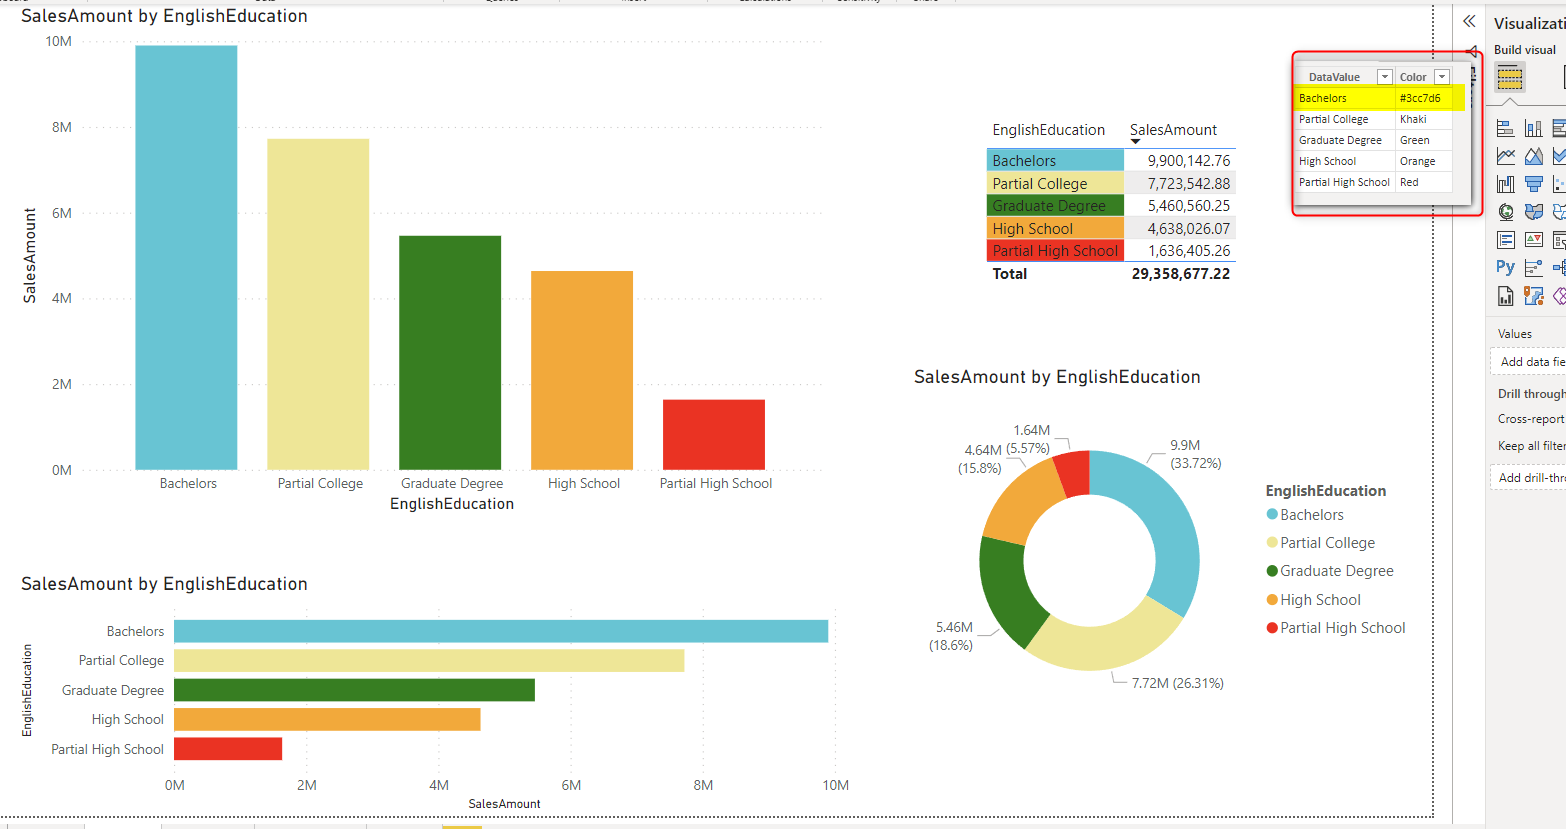
Once this is done for all visuals, you can see they all follow the same color for the same data points. All the visuals below, show Orange for High School.

Changing the color settings
As you see in the above screenshot, the method works beautifully. You can also change the colors anytime you want by changing the values in the color table. You can also use HEX color codes. For example, You can pick colors from a color picker like Google’s color picker (or use your company colors);
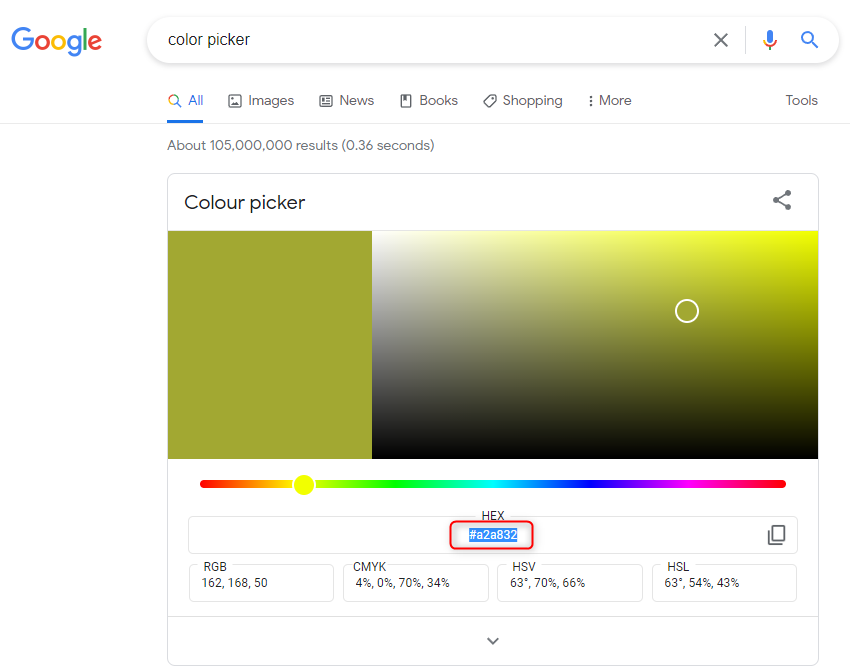
Then you can use them in the table, and as soon as you refresh the Power BI dataset, you’ll get the output colors changed; (if you wonder how to change the values in a table in case you used ENTER DATA to create the table, read my article here.)
Summary
The feature to set the color to data points is not yet available in Power BI. However, I believe this will be available sometimes in the future as a built-in function. In the meantime, the method I explained in this article and video is a simple, easy-to-use, and easy-to-maintain solution. Setting a color for each data point will make your report more consistent, and it also helps users to understand your report much easier.
I provide training and consulting on Power BI to help you to become an expert. RADACAD team is helping many customers worldwide with their Power BI implementations through advisory, consulting, architecture design, DAX support and help, Power BI report review and help, and training of Power BI developers. If you need any help in these areas, please reach out to me.
Here are some useful links for this article that helps you understand more details about this article;
- Power BI Theme: Customize Colors, Fonts, and Visual Appearance for Multiple Objects
- Create a Table in Power BI using Enter Data, and How to Edit it
- Find The Data Value using LookupValue DAX Function in Power BI; Simple and Useful
- DAX and Conditional Formatting Better Together: Find The Biggest and Smallest Numbers in the Column


Reza is author of more than 14 books on Microsoft Business Intelligence, most of these books are published under Power BI category. Among these are books such as Power BI DAX Simplified, Pro Power BI Architecture, Power BI from Rookie to Rock Star, Power Query books series, Row-Level Security in Power BI and etc.
He is an International Speaker in Microsoft Ignite, Microsoft Business Applications Summit, Data Insight Summit, PASS Summit, SQL Saturday and SQL user groups. And He is a Microsoft Certified Trainer.
Reza’s passion is to help you find the best data solution, he is Data enthusiast.
His articles on different aspects of technologies, especially on MS BI, can be found on his blog: https://radacad.com/blog.
Do you know why doesnt it work with chart bar in label part ? We couldnt apply a dynamics colors on label of chart bar. Does it a Bug ?
Hi Karim
This method only works in places where the conditional formatting on color (or background color essentially) is possible. If that option is not available there yet, then it will be available perhaps sometimes soon in the next updates of Power BI Desktop.
Cheers
Reza
Wow Reza, A very cool methodology for assigning the same shade/color to each data point across pages and visuals. I had been struggling with this for some time. Having an external online Excel file where my “data point = color table” is allows me and my team quick changes to the look of the dashboards and reports.
Hi Matthew
Thanks for your kind words. I am glad it helps 🙂
Hi Reza,
Still, you have to define a color for every possible dimension value. Undefined values will stay blue. That would be nice if we could keep dimension colors automatic (where colors are distinguishable as long as their cardinality is low), still uniform accross report.
Hi David
That is right. This method can be enhanced with a default set of colors table and if dimension members are only up to certain values (4 or 5) let’s say, it uses the distinguishable default values from there.
Cheers
Reza