
I have written a dozen of blogs and a book about Power BI row-level security and the security on the dataset. However, I always get this question that: “What if I want some people to see only a few pages of my report, and some others to see other pages?” or “How can I put security for different pages of Power BI report?” In this article, I am going to explain a solution to that.
Row-Level Security is all about the Dataset
Before you ask me about this feature in the row-level security, I have to mention that the row-level security in Power BI is all about the dataset. What does that mean? that means you define the security at the dataset level, not at the visual level. Using the row-level security, you cannot say this role has access to one page, and another role has access to another page or another visual.
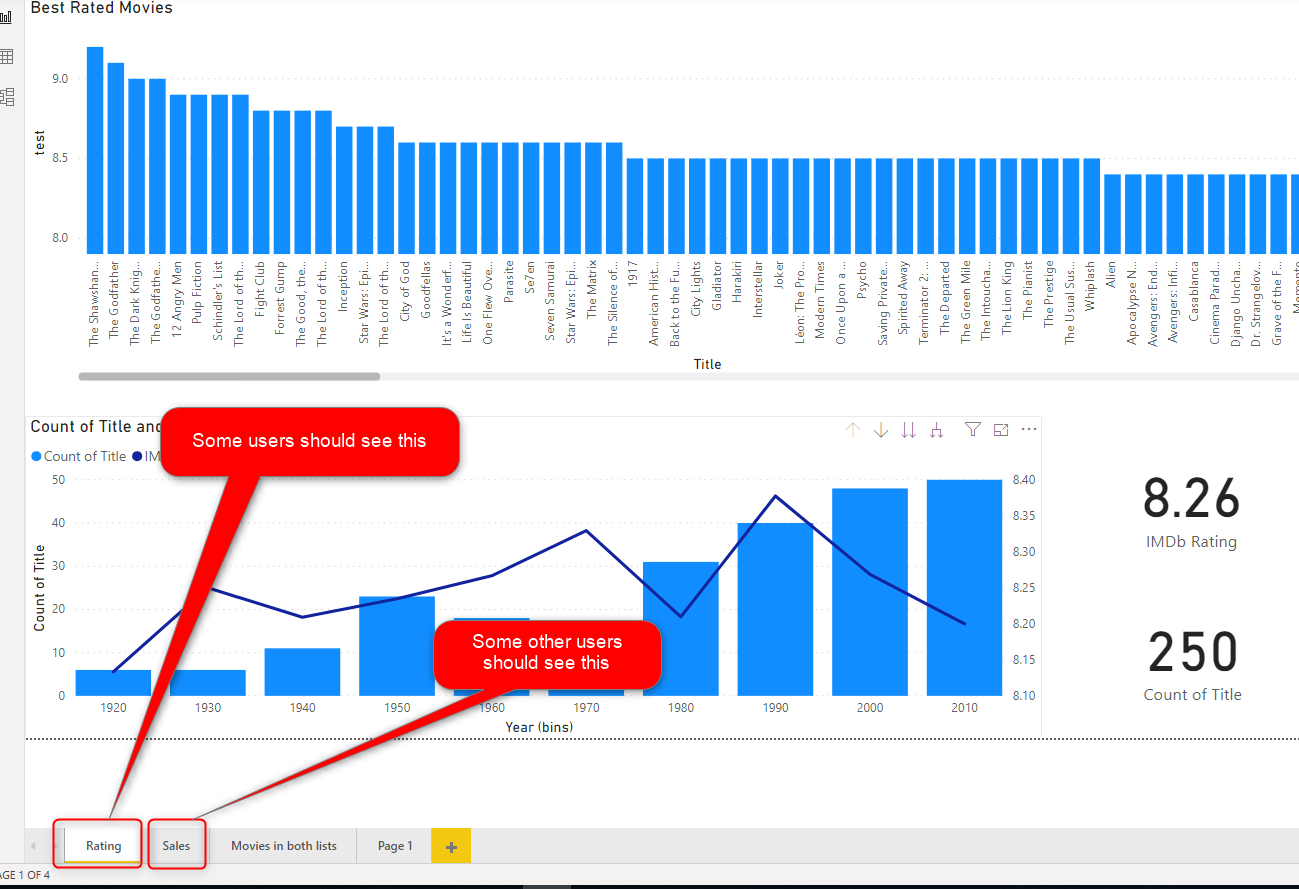
So, then how do you implement such a thing? how if in the below example, you want to share the “Rating” page with some users, and the “Sales” page with some others?
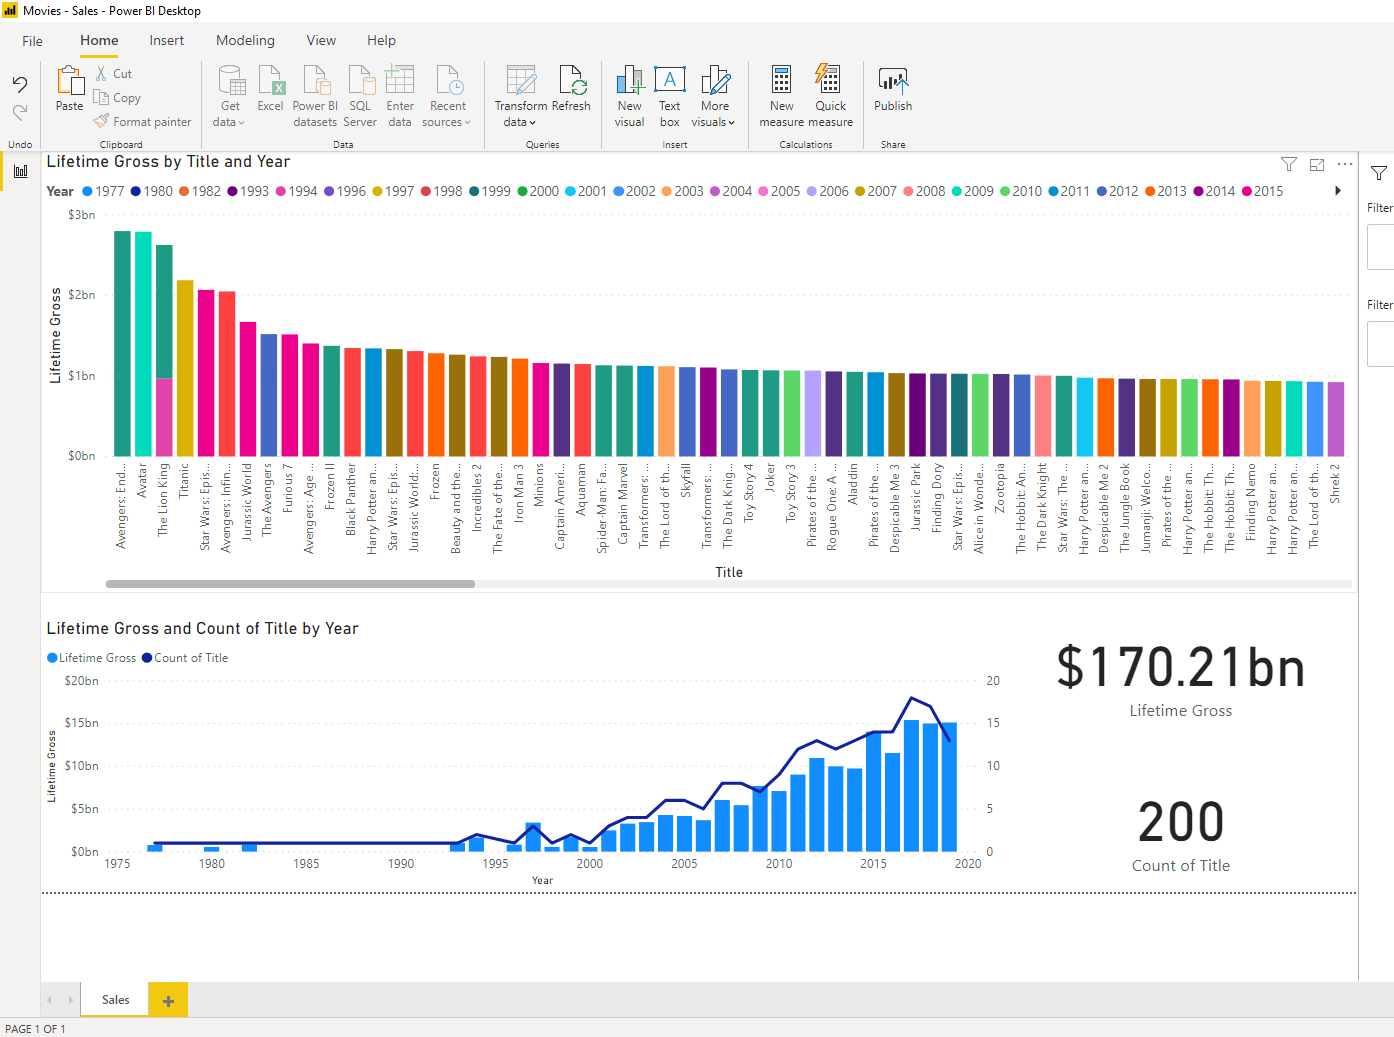
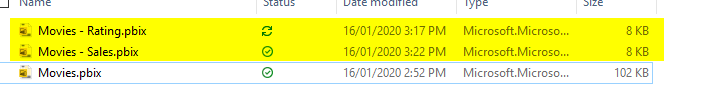
let’s assume we have a file called Movies.pbix as below;
I am explaining the solution using copying visuals and shared datasets.
Shared Dataset
A shared dataset is a Power BI dataset that is used in multiple reports. You can make any datasets a shared dataset. The first step is to publish your original Power BI file to the service;
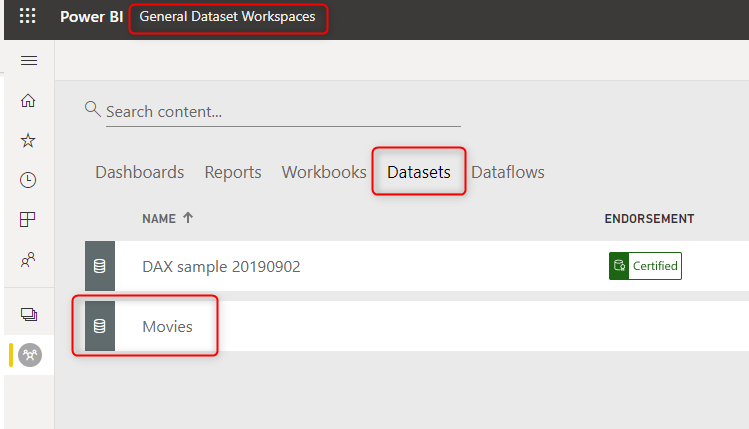
Now, this dataset, can be used to create any other reports using the Get Data from Power BI datasets:
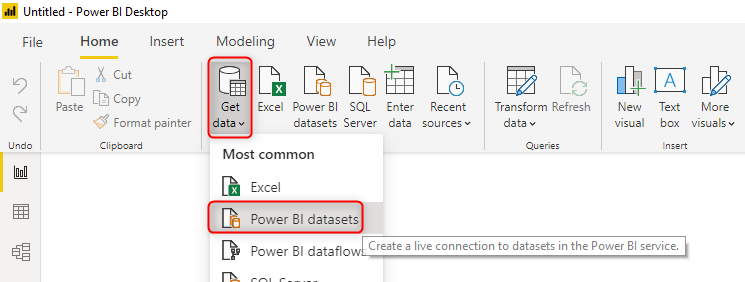
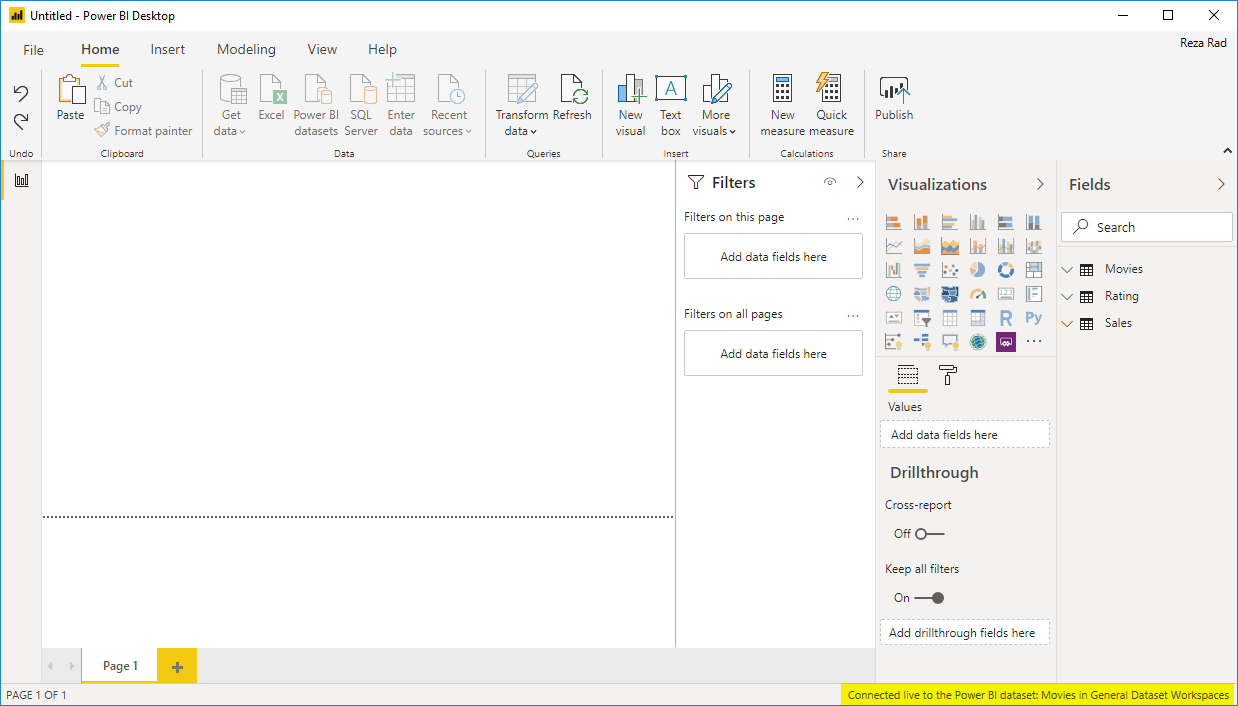
Then if you select the dataset that we published in the previous step, you will get a live connection to that from Power BI desktop;
Separate Visualizations
now that the row-level security on the dataset cannot resolve this requirement, here is the way to do it: you can separate copies of your visuals into two different Power BI reports. but we don’t do it like a normal copy. every copy would be sourced from the shared dataset. the first step is to create a Power BI file to get data from Power BI dataset as you have seen above.
Then select all visuals in the original Power BI report for one of the pages (let’s say Rating page): Ctrl+A to select all, and then Ctrl+C to copy them.
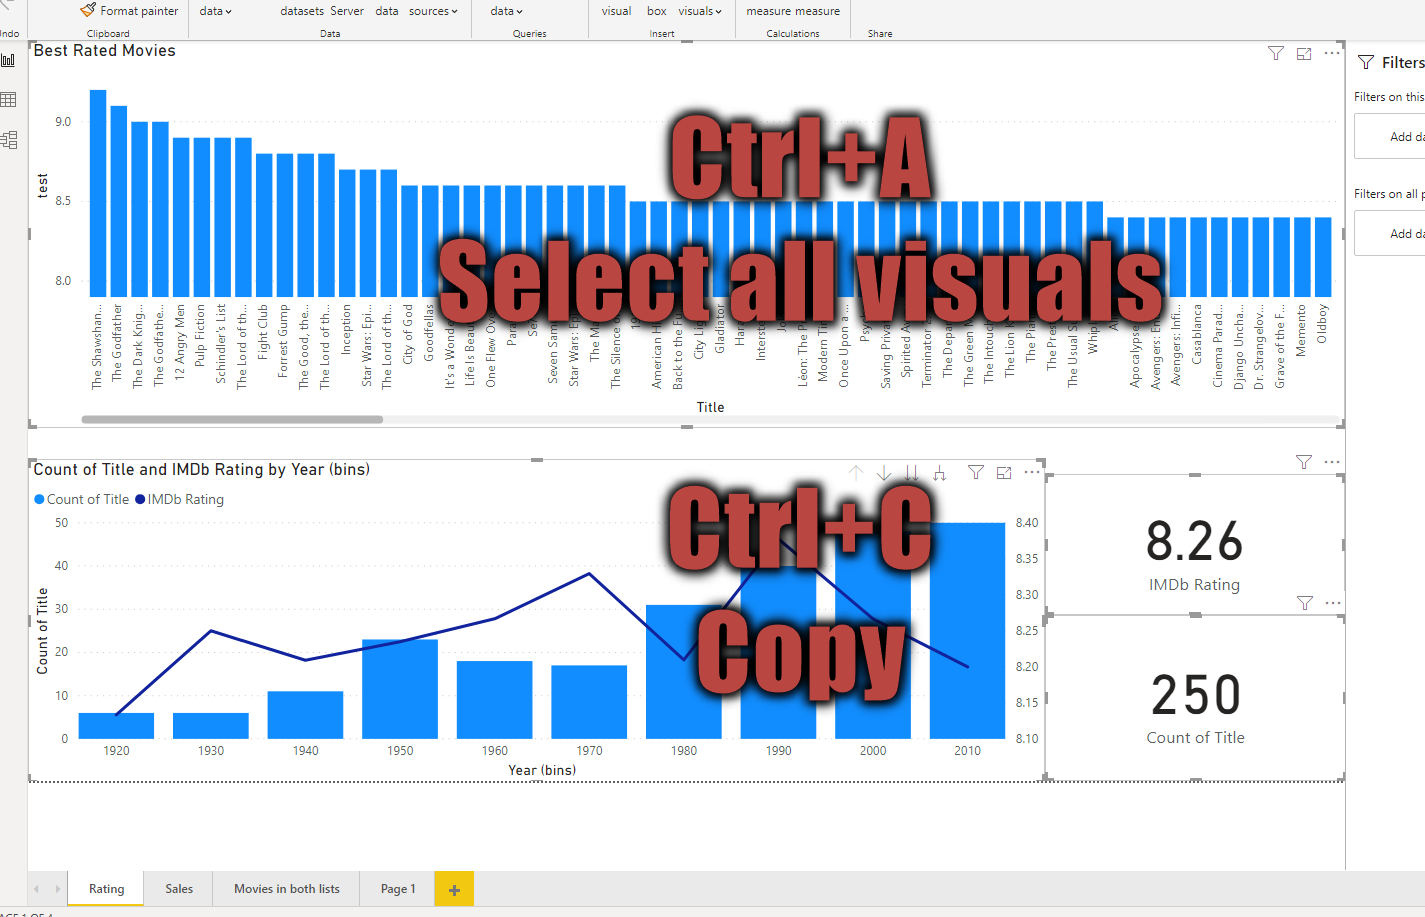
and then paste it into the file with live connection to the Power BI dataset. because all field names and measures are the same, you should see the results immediately; Ctrl+V to paste
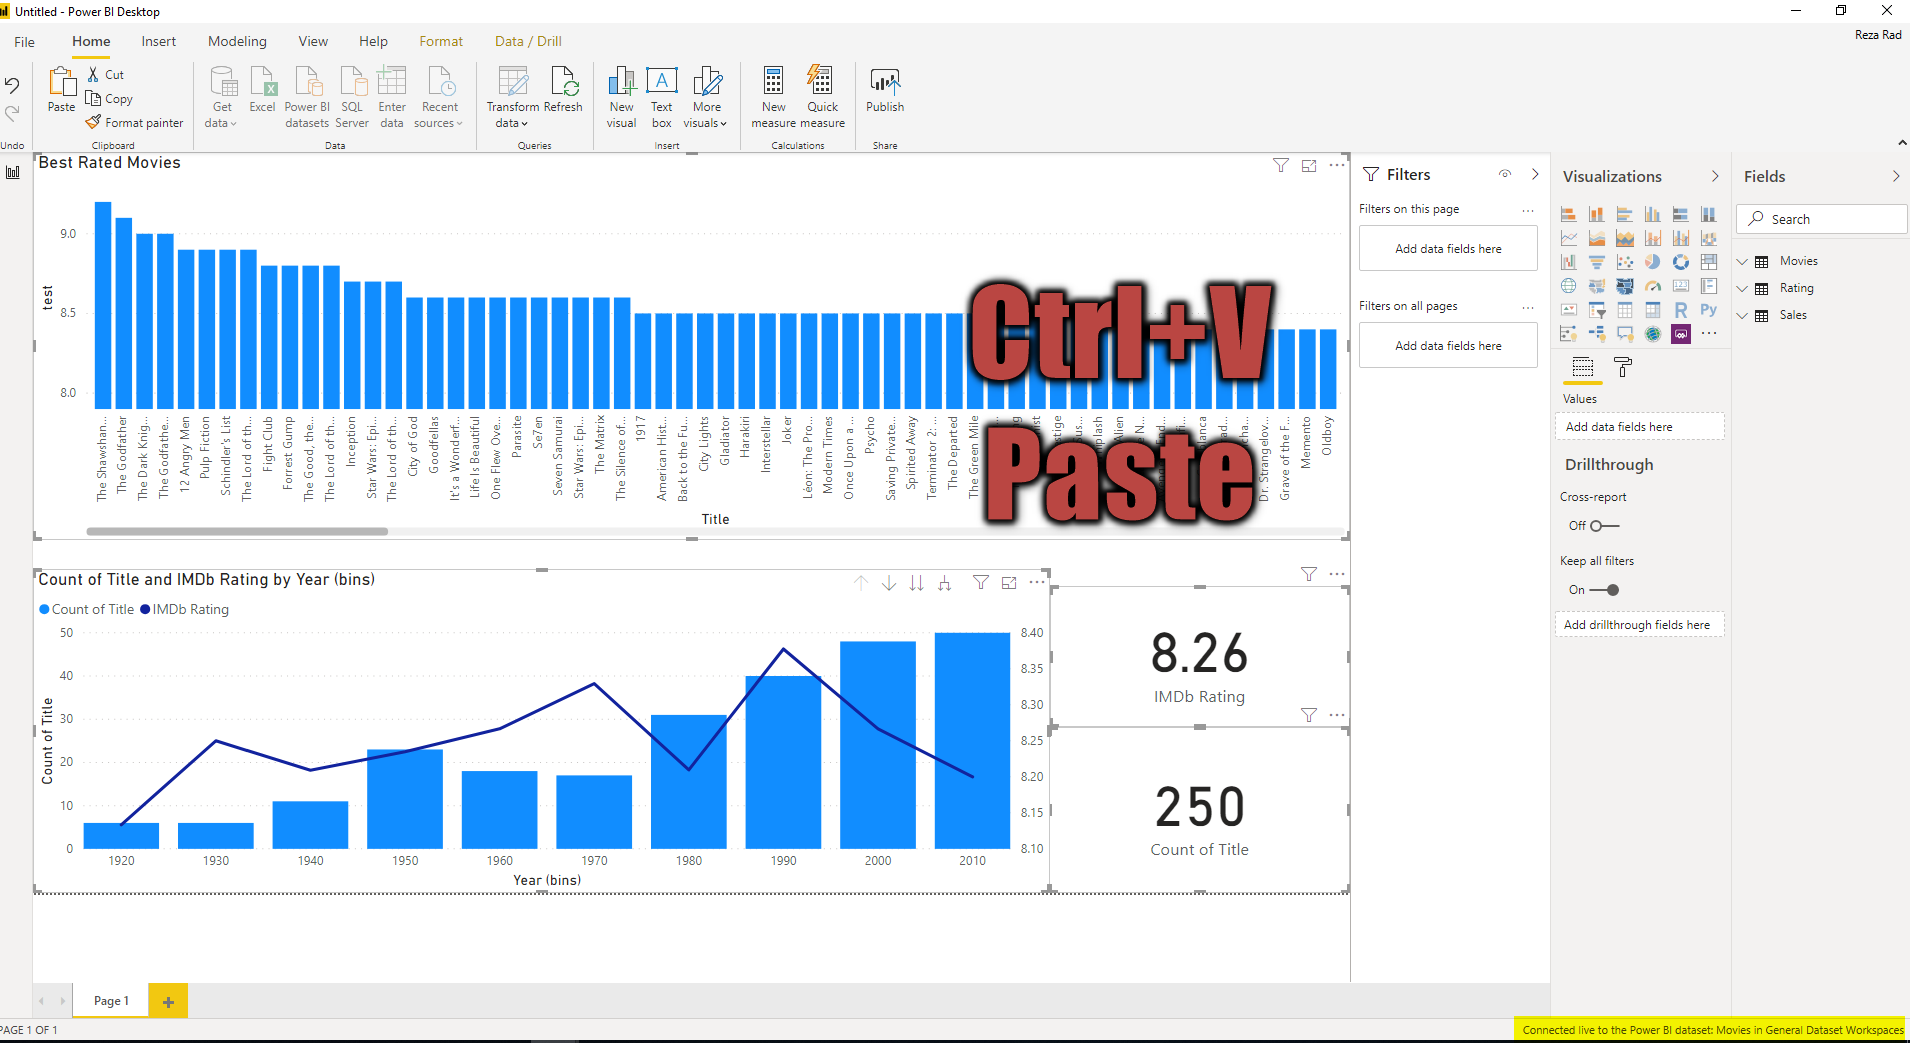
*Remeber that if you have report page filters or page level filters in the original report, then copy and paste won’t bring them here, you need to do that manually.
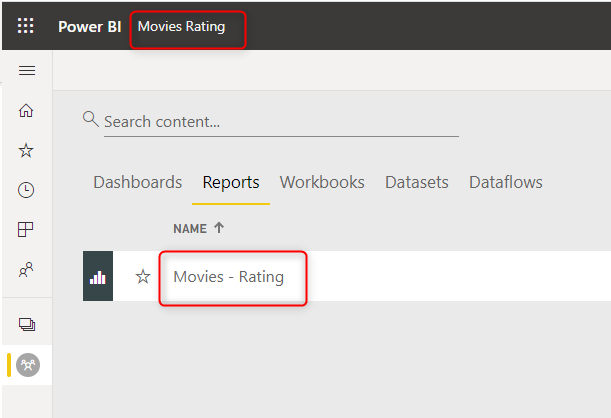
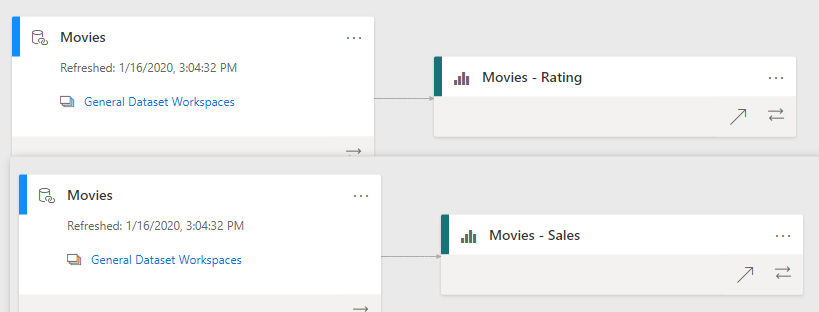
You can now rename this report to Movies Rating and publish it to a totally different workspace, or even the same workspace with different sharing configurations. Here is an example of published to another workspace:
When you publish the report to a workspace that is not the same workspace as the original dataset, it will create a linked dataset to that;
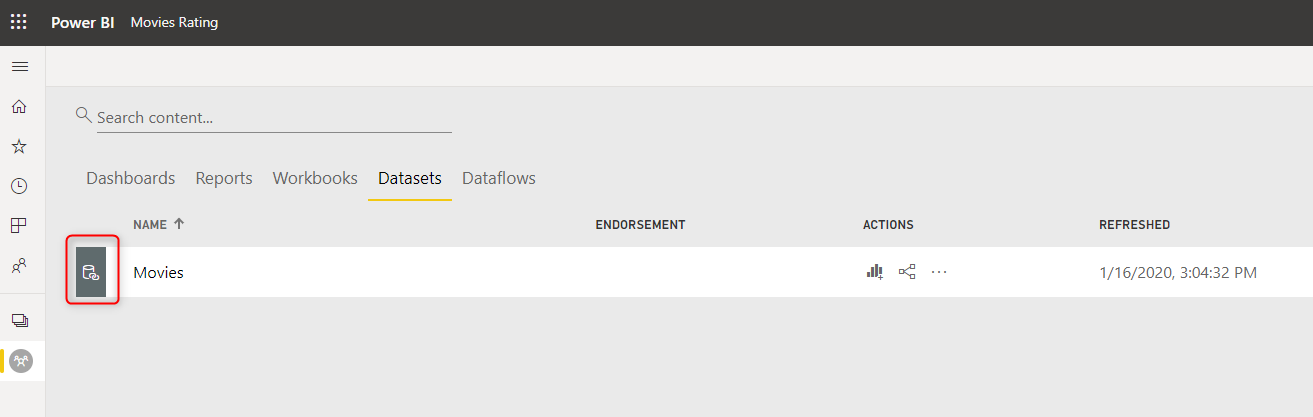
A linked dataset is just a link to the original dataset, the refresh configuration is set on the original dataset.
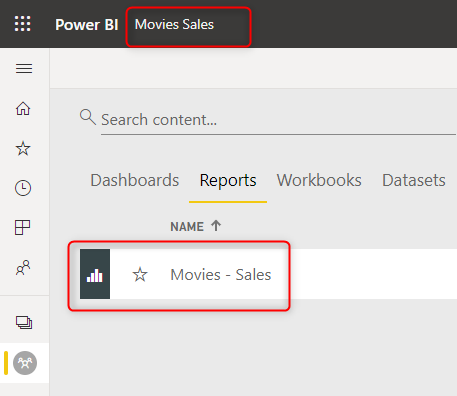
You can then do the same thing for any other reports. for example; Movies – Sales is my other report created in the same way and published in another workspace:
and this report is also in its own workspace:
Share with different Audiences
Now because we have two different workspaces, we can easily create two different Power BI Apps to two different audiences, and they will only see their own report:
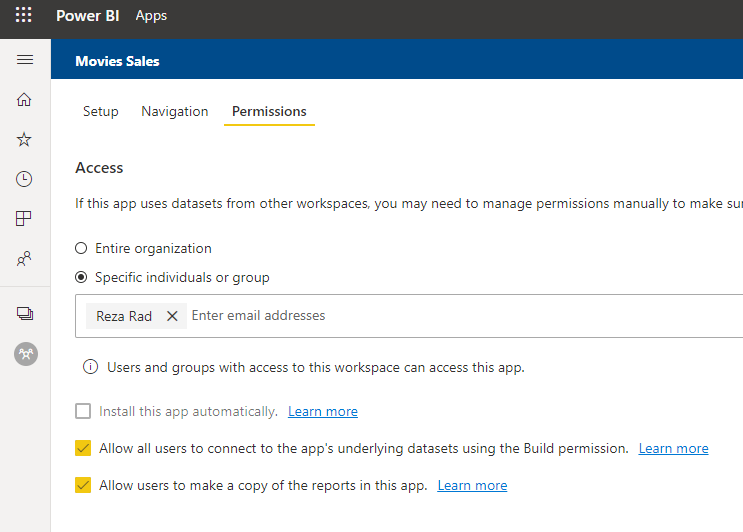
*Remember that for this method to work, users of this app, need to have read access to the dataset in the other workspace.
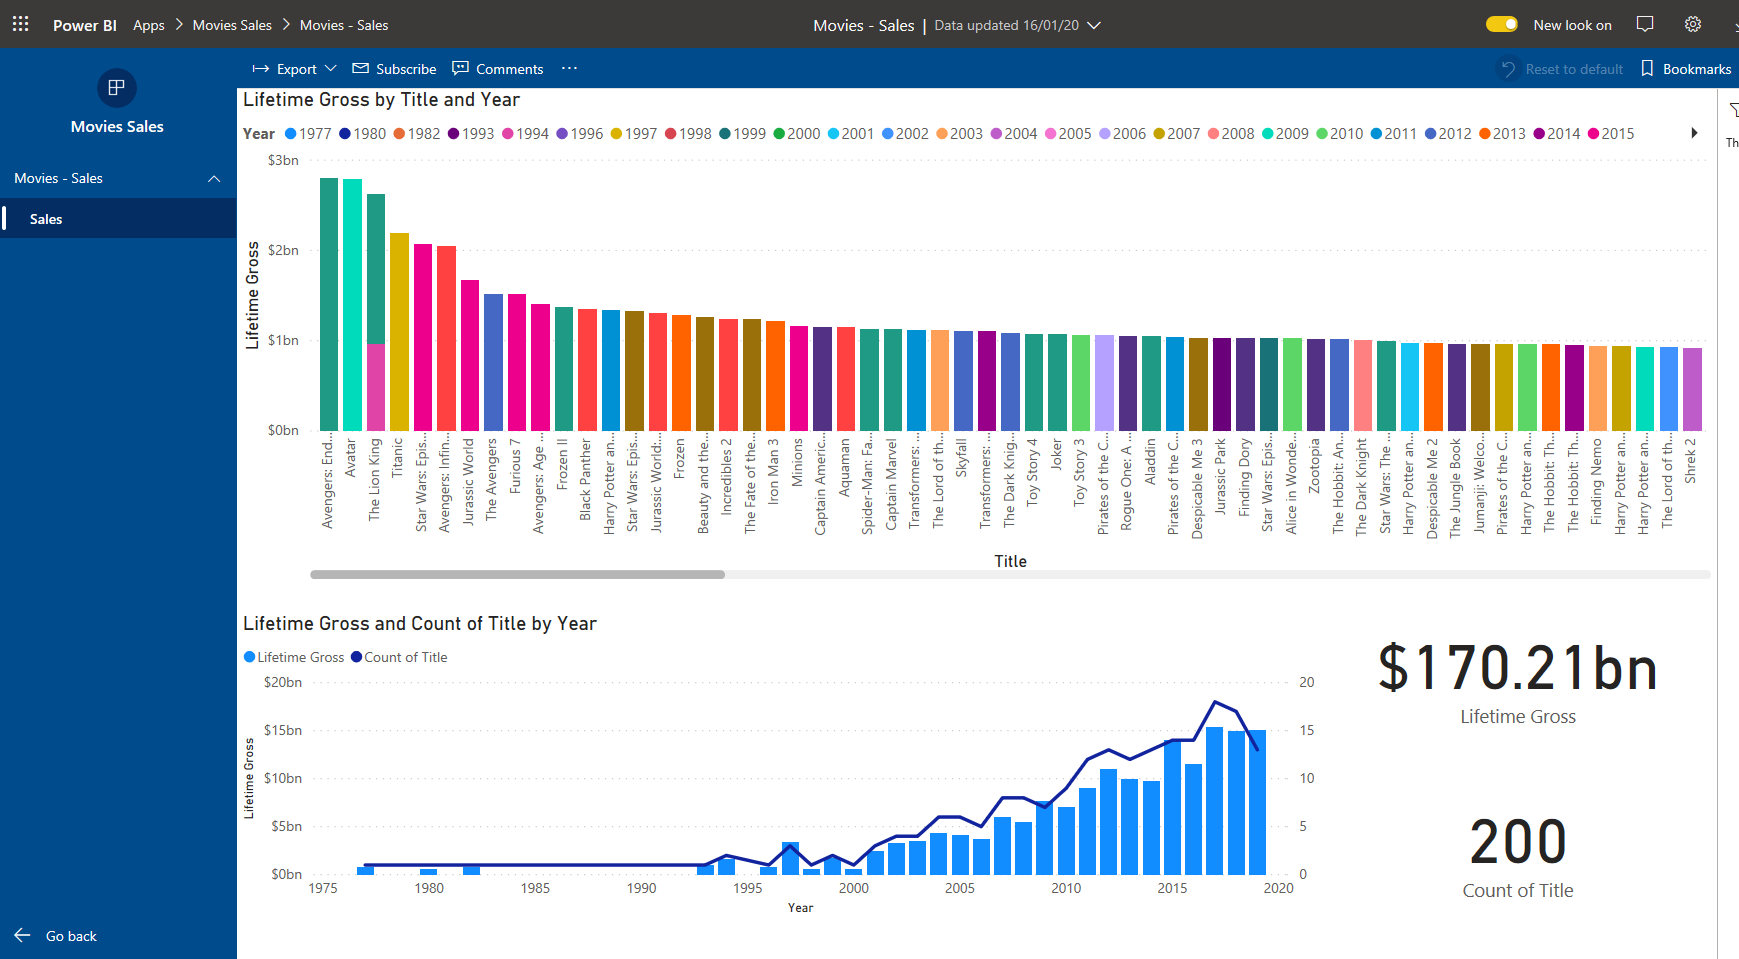
And this is the user view of the content: user below only see the sales page
Important considerations
- Because in this method, the security is not implemented on the dataset, the user has access to the data anyways (unless you set up RLS). so if user creates their own report on the dataset, they can build whatever they want.
- The main benefit of this method is the usage of a shared dataset because the normal copy will create a big overhead of maintaining multiple reports and code logic. In this mode, the visualization is separated from the modeling, to read more about this architecture implementation read this article.
- The shared dataset also means that the refresh of data happens once, and all reports are connected to that centralized data.
- The new file copies would be small because they do not contain data, they are just visualizations;
Summary
In Summary, row-level security is all about the dataset, not the visuals. If you want to share different visualization pages with different audiences, then creating a copy is the only way at the moment. The method mentioned in this article, however, explains how you can do that with the lowest maintenance cost. using a shared dataset, and multiple workspaces, you can have still one single source of your logic, but visuals shared with two different sets of audiences.
Video


Reza is author of more than 14 books on Microsoft Business Intelligence, most of these books are published under Power BI category. Among these are books such as Power BI DAX Simplified, Pro Power BI Architecture, Power BI from Rookie to Rock Star, Power Query books series, Row-Level Security in Power BI and etc.
He is an International Speaker in Microsoft Ignite, Microsoft Business Applications Summit, Data Insight Summit, PASS Summit, SQL Saturday and SQL user groups. And He is a Microsoft Certified Trainer.
Reza’s passion is to help you find the best data solution, he is Data enthusiast.
His articles on different aspects of technologies, especially on MS BI, can be found on his blog: https://radacad.com/blog.
Thanks! As always your articles are the best. I have a question about using the shared dataset method and sharing out reports to different audiences, but not granting Build access. If I don’t grant them Build access and I do grant them Read access to the underlying dataset in a separate workspace, they would still only be able to see the Report, right? They would have no way of having access to the underlying dataset? I haven’t found any clear documentation online, but this seems like it would be a very common scenario as it is such a handy way to handle security for different audiences. Thanks!
Thanks
If you just share it read-only, let’s say through publishing Power BI Apps, and also uncheck the option that says “User can connect to the dataset and build their own version of the report”, then they would not be able to build any reports, or modify your report.
Cheers
Reza
Thanks for this. I’m fairly new to BI, so excuse the naivety, but using this method, where two different reports are being created, why not just hide pages in one versus the other in Desktop prior to publishing?
Hi Matt
this is also a good suggestion, hiding report pages I mean.
However, you still want reports to get data from a shared dataset. Using it this way you minimize the efforts of data modeling
Cheers
Reza
Hi Reza,
thanks for a good article.
One the note of separating the visuals from data – I think there is a better way:
– duplicate the PBIX file
– go to the copy and delete all queries in the query editor (visuals will now look broken)
– get data > Power BI Dataset
– voila – report now works, plus you have all of the filters
Since we often put a lot of effort into the filter pane (and let’s not forget the drillthrough), it’s quite valuable to have all this report logic preserved.
Hi Radek
Great suggestion, especially if you have too many pages to copy or even filters.
Cheers
Reza
Nice trick and good to use, but in general this doesn’t solve the issue described in the header i.e. how to show hide some pages from certain users without creating separate report (pbix file, not data model).
I guess one workaround could be make a table to look like a button and place some transparent buttons on top of that table with bookmarks linking to other hidden sheets. So with RLS control what sees the page names, and for those who are not supposed to see other pages it wouldn’t be visible (even though still clickable). But haven’t tried it myself to set up something like that in real world yet 🙂
Hi
Thanks for the comment.
Not sure I understand your workaround. It would be great if you can explain more.
As you mentioned, this is not, of course, a solution, it is a workaround as an interim solution. Hopefully, visibility of visuals and pages will be editable using DAX measures at some point and we won’t need this workaround anymore.
CHeers
Reza
A very good article.
The takeaway appears to be separating user access is achieved by creating separate work spaces, duplicating the reports and customizing them for each workspace and controlling access to each workspace. While this is a straightforward approach it does increase the burden on Developers and Admins to manage the forked reports.
I would love to see an approach that relies on the identification of the user to limit access to pages, visuals and data. The idea of Row-level security will only continue to grow ans Power Bi is adopted in the enterprise.
Thanks again for the effort and great articles!
Hi Patrick
I would definitely love to see the ability of toggling the visibility of visual (and even pages) using a DAX measure (like what we have already for conditional formatting in some visuals), However, for such a feature, we might have to wait a long time ?
Cheers
Reza
Hi,
I usually like your article. But this is one is clicbait and doesn’t do what the title say it provide a solution for.
Of course we can create multiple workspace, the title should be: How to use multiple workspace to share part of a dataset.
But this doesnt provide a solution at all to split page per user using row level security.
You now have 2 workspace to support, 2 app to publish and 2 report to update in case of dataset change.
Mike
Hi Mike. As I mentioned through the post. This is a workaround, not a solution. Until the time that such a feature be implemented in Power BI.
Regarding the two workspaces and two apps etc; Considering that we have two different types of audiences, it makes sense to have two different apps for them. Of course, there is an overhead, and I am not saying it is perfect. but better than no solution!
Cheers
Reza
Reza,
I really like this workaround but have a question. I have a PowerBI report that is shared within our small team. However, I would like to share two tabs out of the five tabs of the report to the whole company. From this workaround, seem I can create a live connected report for the two tabs which I can give access to the whole company. However, you mentioned that the same user (in this case, the whole company) also needs to be able to access to the original dataset. So, how does this work? If I give the whole company access to the original dataset, does it mean that whole company can access to the other three tabs which I didn’t want to share outside of our small team?
accessing the data source does not necessarily mean accessing report tabs. It mean access to the dataset itself, which is for self-service users a way to build their own reports. If your users are not that kind of user , and they are just end-user, then it won’t be a matter of worry.
Cheers
Reza
Thank you Reza! Got it now!
I followed this approach and published 2 reports, sharing 1 dataset. However, now how can I add users to security roles for the second report? Since it is all apparently linked to just the first report.
Since it is all coming from one dataset. the security group and roles needs to be defined only in that ONE dataset.