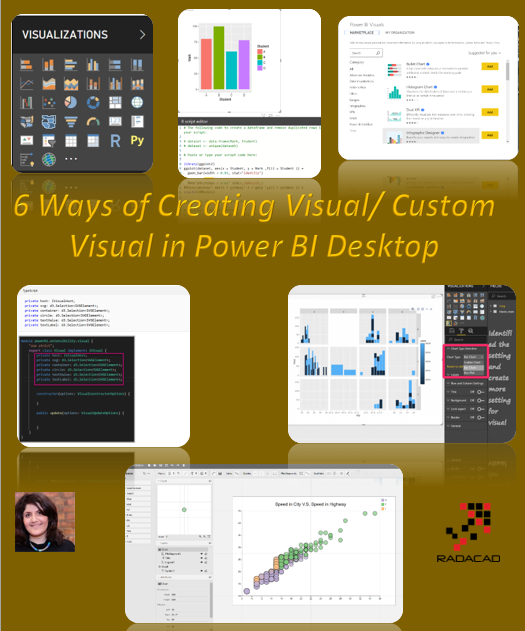
Create Visual/Custom Visual for Power BI: Different Approaches
There is always a need to extend the usage of visuals in Power BI. There are multi ways to do it first using First Option: Using Standard Panel Easy to use and available all the time all tested and reliable Read more about Create Visual/Custom Visual for Power BI: Different Approaches[…]