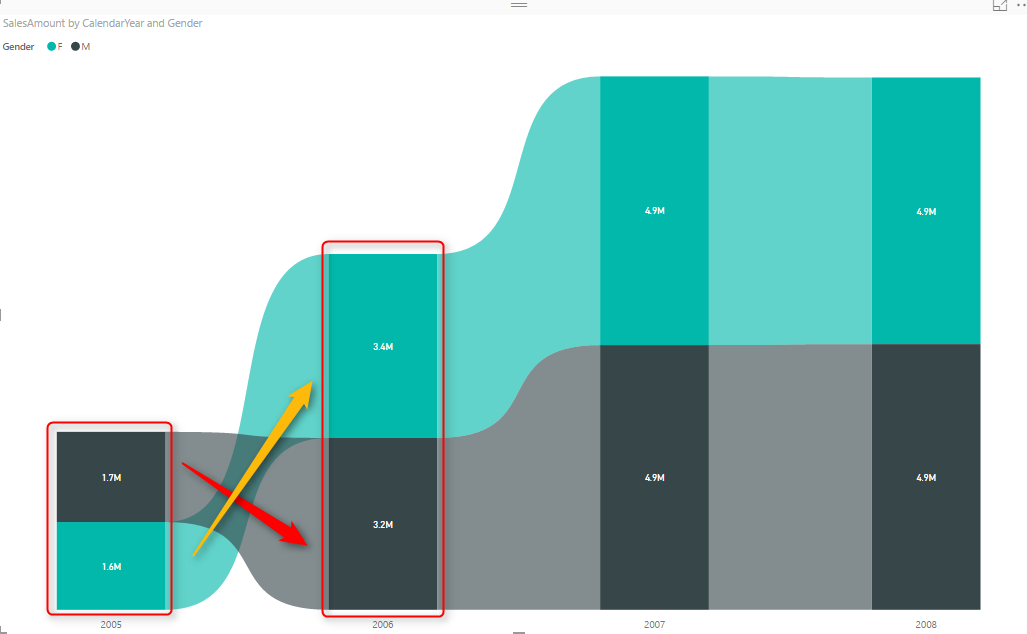
New Series of Time Series: Part 3 (Holt’s Exponential Smoothing)

In the last posts, I have explained the main concepts behind the Timeseries (Post 1) and  in the second one a simple forecasting approach name as “Exponential Smoothing” has been proposed Post 2. In this post I am going to show how to do see the error of forecasting and also how to forecast when Read more about New Series of Time Series: Part 3 (Holt’s Exponential Smoothing)[…]

Infographic Designer: Not Just Another Visual

At the time of writing this post; there are already more than 97 custom visuals posted in Office Store. The list includes many interesting custom visuals. However, Infographic Designer is one of the visuals that is not just another visual. This custom visual has some unique features that you cannot see in many other visuals. Read more about Infographic Designer: Not Just Another Visual[…]

New Series of Time Series: Part 1

In this new series I am going to look at the time series models and how we able to use them for forecasting data. The first need in timeseries data is to have a series of data for years or for some qurdant. imagin that we have a time series data on birth rate from Read more about New Series of Time Series: Part 1[…]

Power BI Custom Connector: Connect to Any Data Sources. Hello World!

One of the recent features in Power BI Desktop is the ability to create your own custom connector and use it when connecting to the data source. This feature looks just one feature, but it opens doors to many possibilities. With this feature you can write your own custom connector to any types of data Read more about Power BI Custom Connector: Connect to Any Data Sources. Hello World![…]

Choose the Right Merge Join Type in Power BI

Previously I have written a blog post explaining two ways of combining data sets with each other; Append vs Merge. In this post I want to explain in details what is the difference between all types of Merge Type and explaining how to choose the right merge (or Join) type. These Merge types are very Read more about Choose the Right Merge Join Type in Power BI[…]

Optimization Problem in Power BI using R scripts: Part1

There are some traditional problems in most of industries like how we can reach maximum profit, sales, production or how we can minimize our cost and loos. These types of problems can be seen in different areas such as microeconomic and company management, such as planning, production, transportation, technology . Although the modern management issues Read more about Optimization Problem in Power BI using R scripts: Part1[…]

Online Book: Analytics with Power BI and R

About the book; Quick Intro from Author In 2016, after bringing the capability of writing R codes inside Power BI, I’ve been encouraged to publish an online book through a set of blog posts. The main reason to publish this book online, was that there is no integrated and comprehensive book on how to use Read more about Online Book: Analytics with Power BI and R[…]

Edition 3 of Free Book: Power BI from Rookie to Rock Star – 1075 Pages!

Busy schedule in last few months with lots of conferences and courses didn’t allowed me to publish 3rd version earlier. and now, here you go; 3rd edition of Power BI from Rookie to Rock Star book is available to download. this edition ended up with being 1075 pages! This book is already downloaded more than Read more about Edition 3 of Free Book: Power BI from Rookie to Rock Star – 1075 Pages![…]

Basics of M: Power Query Formula Language

M is the powerful language behind the scene of Power Query. Any transformation you apply will be written in M language. For many, M looks like a scary language. In this post I like to explain a bit of basics of M. Not mentioning any functions. Mainly I want to explain to you how the Read more about Basics of M: Power Query Formula Language[…]

Interactive Charts using R and Power BI: Create Custom Visual Part 3

In the last two posts (Part 1 and 2), I have explained the main process of creating the R custom Visual Packages in Power BI. there are some parts that still need improvement which I will do in next posts. In this post, I am going to show different R charts that can be used Read more about Interactive Charts using R and Power BI: Create Custom Visual Part 3[…]