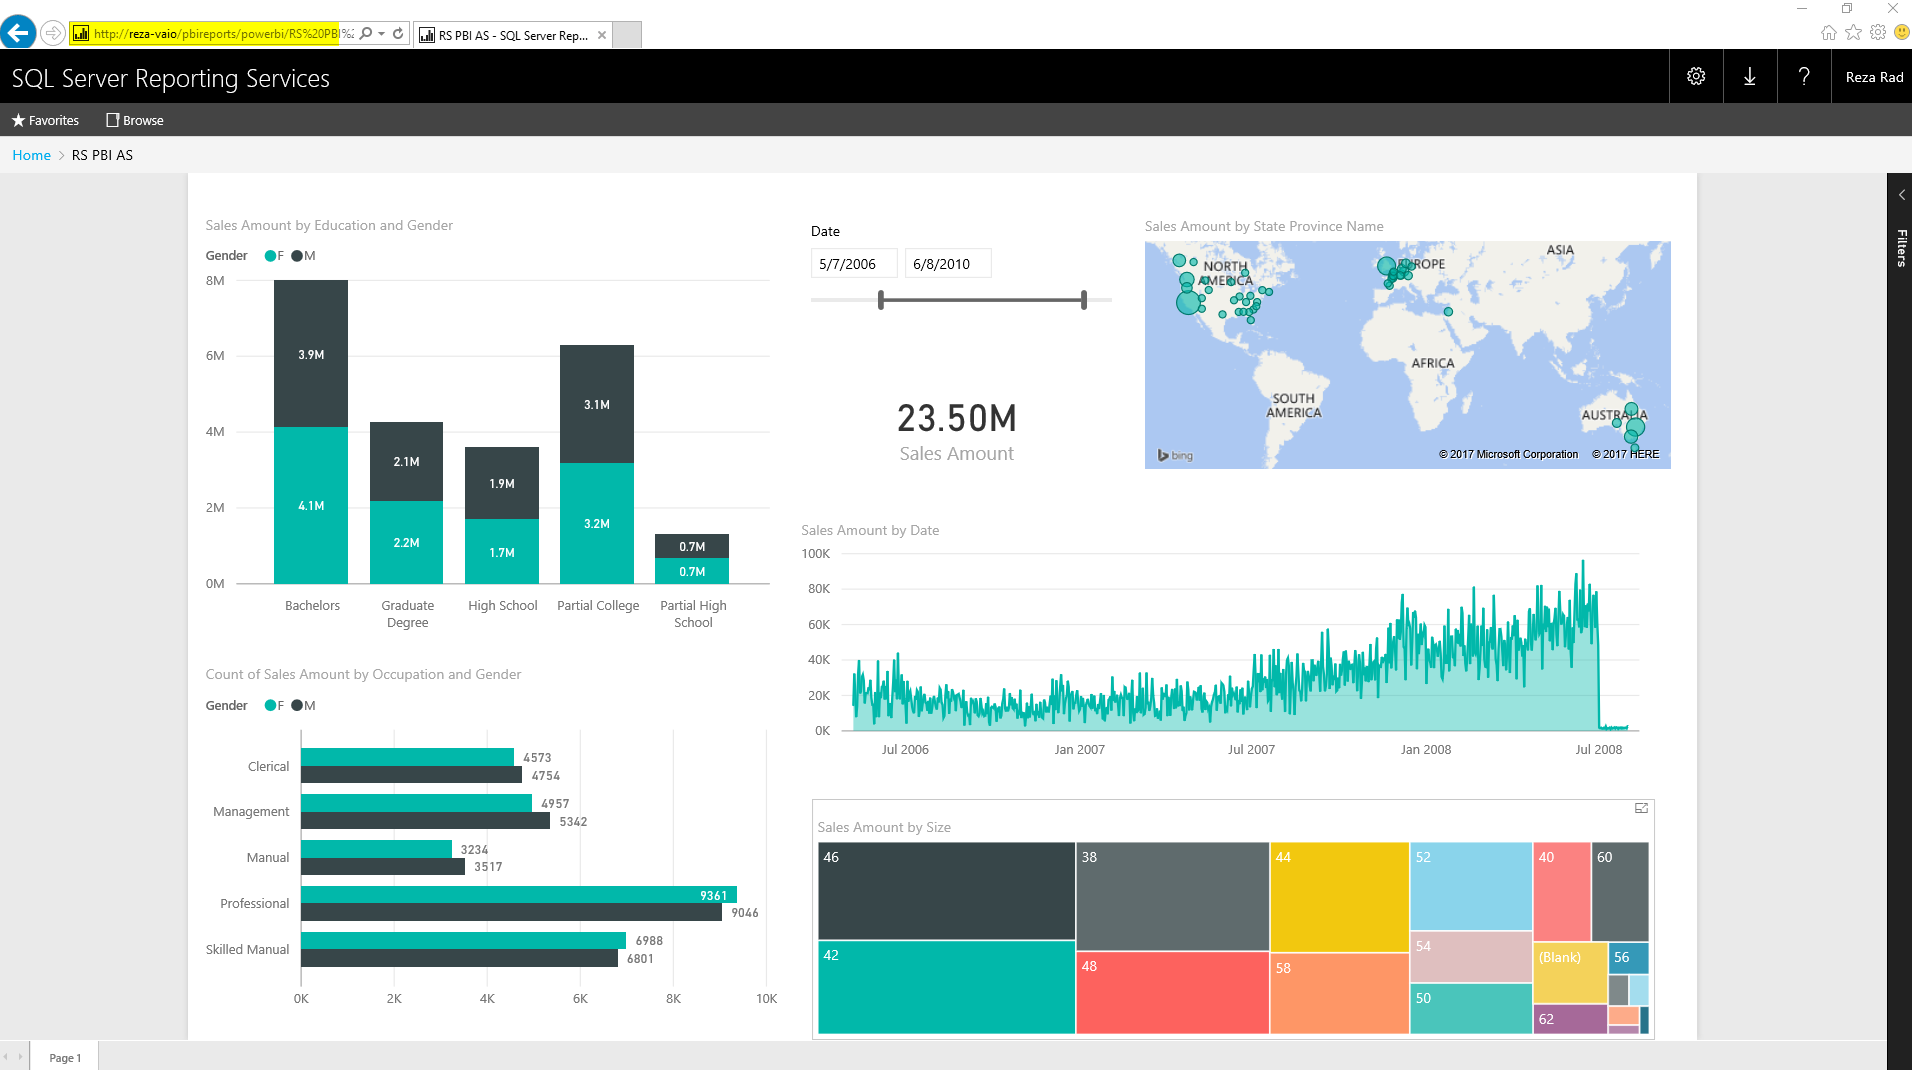
Power BI On-Premises; Hello World!
It has been a very long time request from users around the world to make Power BI available for on-premises, not for using on-premises data sources (this is available from long time ago with gateways), but for publishing reports into on-premises server. With the fast pace of development of Power BI this feature was looking Read more about Power BI On-Premises; Hello World![…]