

I have previously written articles about how you can write a measure in DAX that helps with TOP N filtering. However, you may not need that calculation for many situations. If all you want is just simply to get the top 10 customers based on the sales amount, or bottom 5 products, etc, then you can simply use the visual-level filter GUI to perform this filtering. This is not a new functionality in Power BI, However, many users might not have yet seen it, so I’ll explain it in this short article and blog.
Video
Sample requirement
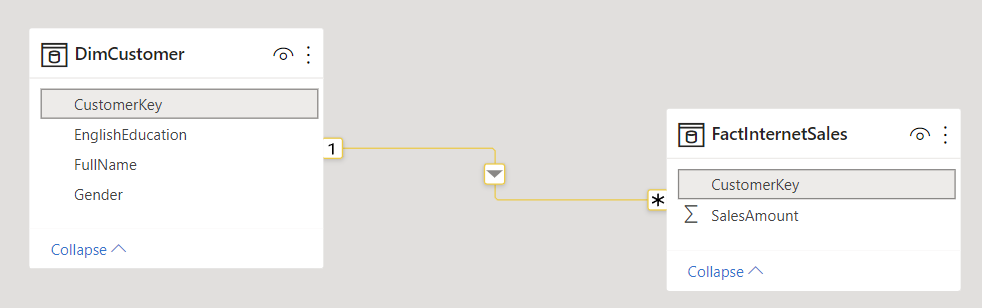
I have a sample data model with two tables; FactInternetSales and DimCustomer as below;
We have a table visual with FullName of customers and the SalesAmount;
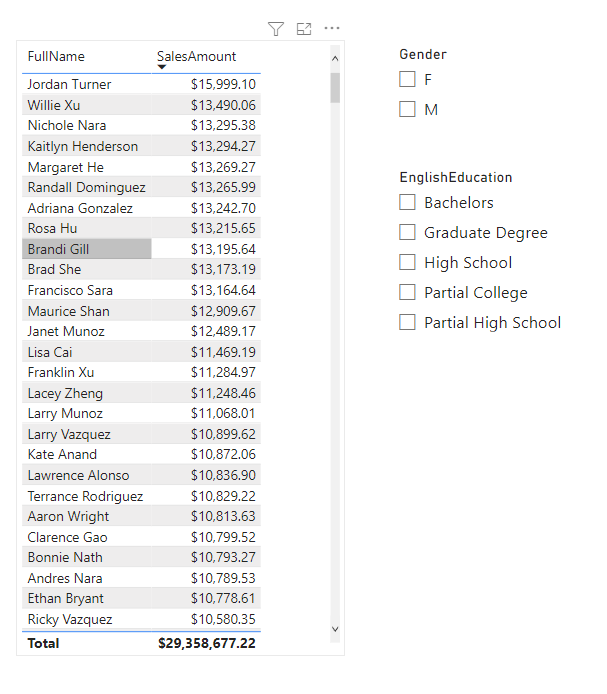
What we are interested to see is just the top 10 customers based on their SalesAmount. This can be done using the visual-level filter.
Filter Settings
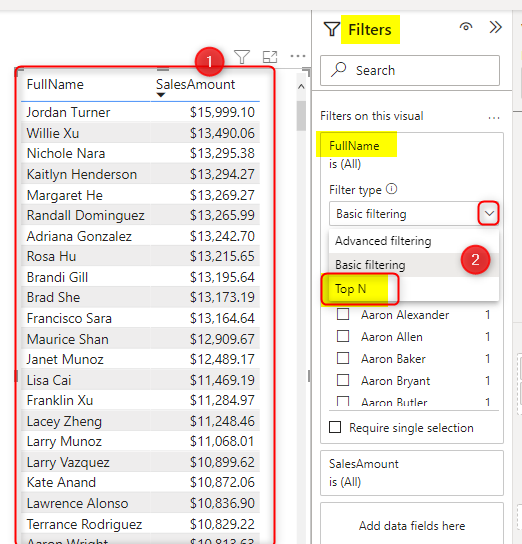
I have previously explained what the Power BI Filter pane is and how the scope of filtering works, plus how you can apply some changes such as font and colors and also hiding and locking filters. When you select the Table Visual, under Visual-level filters, you can see the FullName field there. expand the filter, and in the drop-down of Filter type, choose Top N.
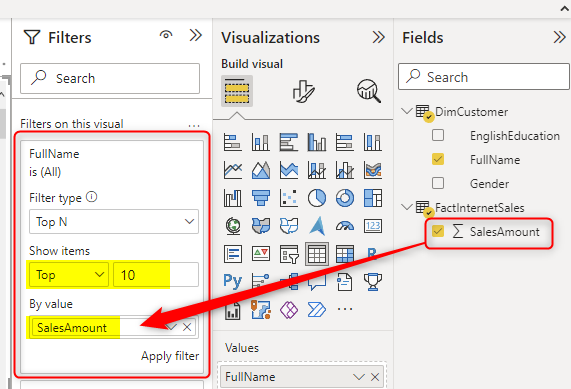
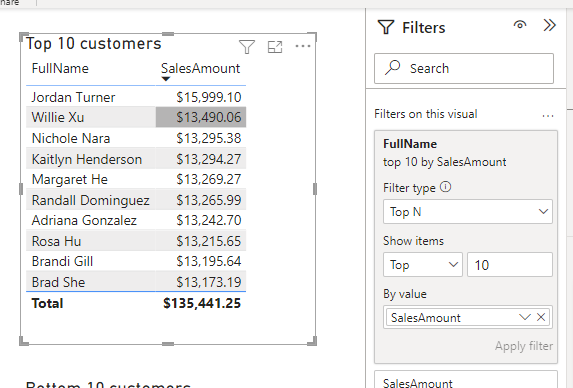
Once you selected the Top N, set the number as 10, and then drag and drop SalesAmount into the “By value” section. This means you want the top 10 FullNames by their Sales Amount. Click on Apply Filter after that.
After applying the filter, you will see that the visual gets filtered for the top 10 customers easily;
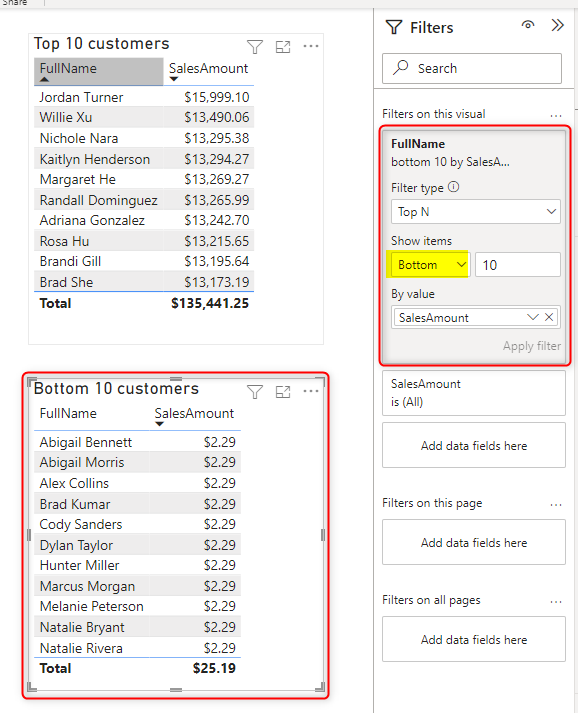
You can use the same method to filter the Bottom 10 customers in another chart;
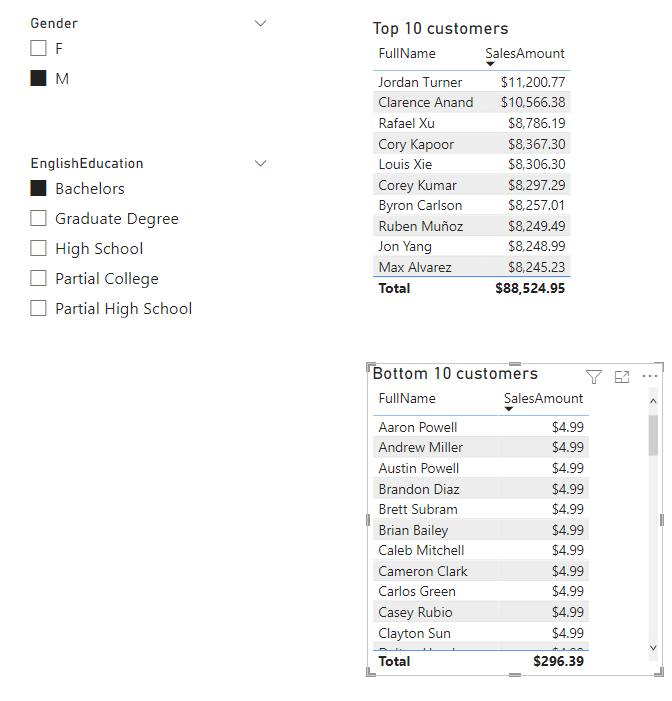
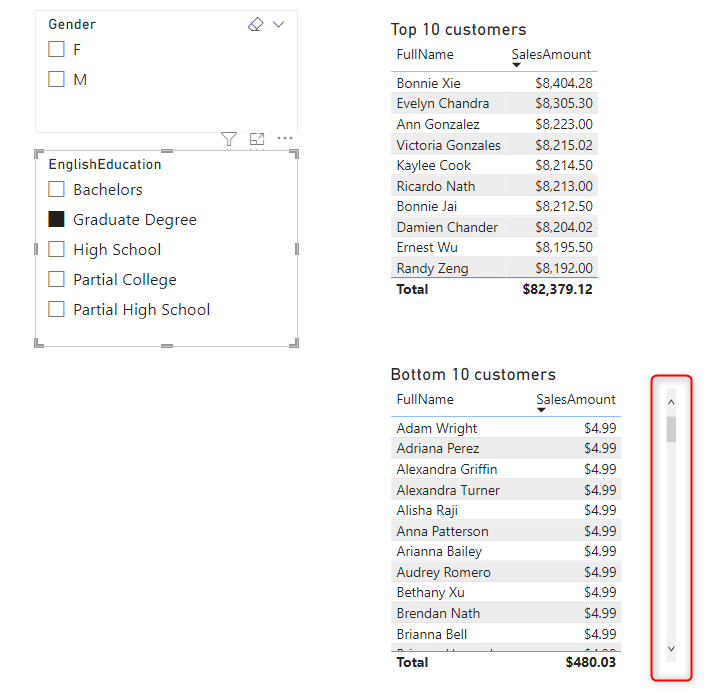
Other slicers and visuals on the page would be still effective in this filtering. as you can see, I can choose the Male category of Bachelors, and then the top 10 and bottom 10 list gets filtered by that easily.
When top N is more than N results!
The filter that you apply on the visual level is using the TOPN DAX function that I explained in detail in my article here. If there is a tie in any of the ranks, then TOP N provides all of the tie options. that is why when you look at the Bottom 10 customers, you will see much more than 10 customers in some cases.
This might be the desired outcome for many scenarios. However, for some scenarios, you may want to get only 10 results. To do this, you can create a measure that returns a unique value per each customer (even if they have the same SalesAmount) based on other criteria, such as their order date or anything else, and then use that in the Top/Bottom N filtering.
Use TOPN DAX Function for advanced filtering
The Top/Bottom visual-level filter works very nicely and is very efficient in creating reports for top or bottom n products, customers, services and etc. However, If you need a more advanced scenario, you can always write a DAX measure using the TOPN function;
Links to study more
I have published other articles and videos related to this subject, read or watch them to learn more;
- Scope of Filter in Power BI Report
- Power BI Visualization Tip: Hide or Lock the Filter for Users
- Customize the Color, Font, and Style of the Power BI’s Filter pane
- TOPN DAX Function: How does it work in Power BI? Comparison against the top group


Reza is author of more than 14 books on Microsoft Business Intelligence, most of these books are published under Power BI category. Among these are books such as Power BI DAX Simplified, Pro Power BI Architecture, Power BI from Rookie to Rock Star, Power Query books series, Row-Level Security in Power BI and etc.
He is an International Speaker in Microsoft Ignite, Microsoft Business Applications Summit, Data Insight Summit, PASS Summit, SQL Saturday and SQL user groups. And He is a Microsoft Certified Trainer.
Reza’s passion is to help you find the best data solution, he is Data enthusiast.
His articles on different aspects of technologies, especially on MS BI, can be found on his blog: https://radacad.com/blog.