
Age banding is a common scenario in analytics, and I have explained how it is possible in many different ways. One of the methods I have explained was using DAX measures and the TREATAS function. Sometimes, however, the age banding can be static, and Power Query can be used for the calculation, which would make the report faster at the end. In this blog and video, I’ll explain how you can have an age band table with columns of start and end, and how Power Query can be used to merge your main table with this table based on Between the start and end columns.
Video
Sample Model
I am using a very simple data model in this example, the table below is what I use as the Sample Data;

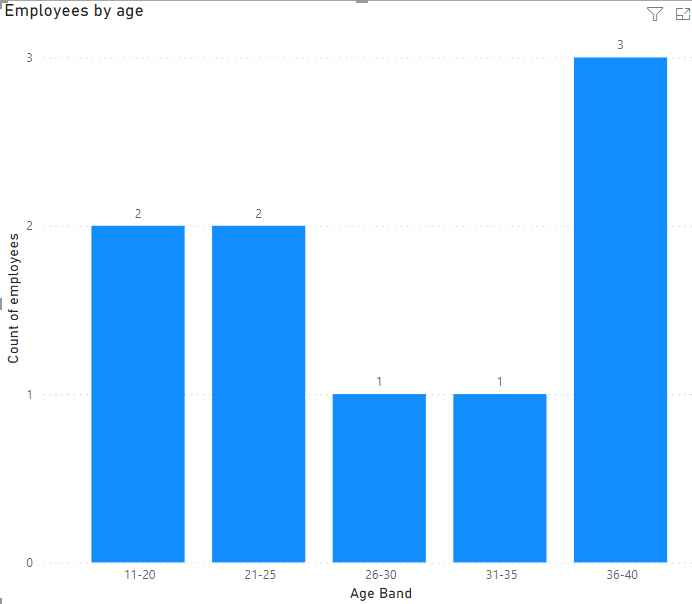
The goal is to have an age group banding for customers and get a count of customers in each group. something similar to this:

Age Band Table
As we need the banding to be the axis of the chart, we need that as a field, You can create an age band table.
and here is an example of the age band table:

As you see, I have bands that are only covering five years (31-35), and bands that are covering ten years (11-20).
This table can't have a relationship with the Sample Data table, because if you create the relationship, then it would only filter data for the start or end of each band, but not the whole range. so the tables remain unrelated.
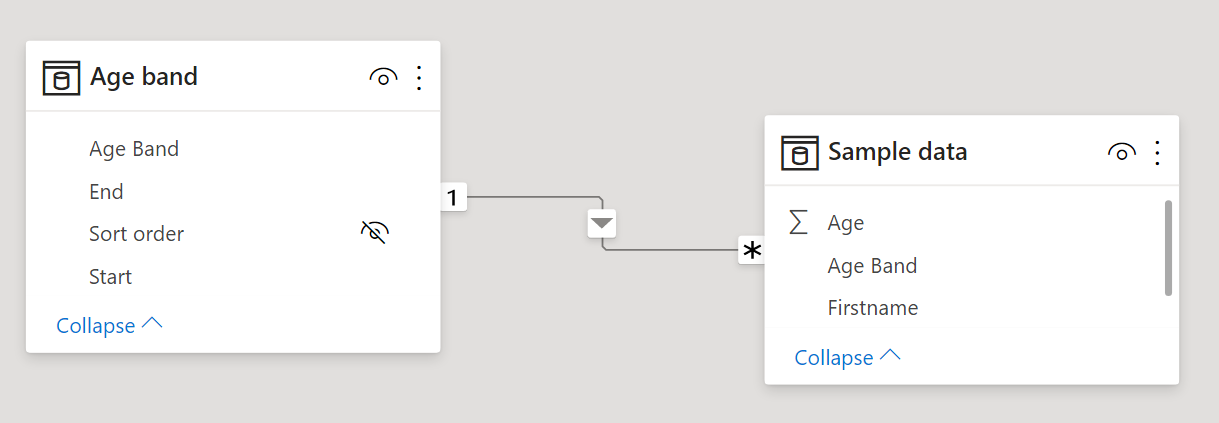
However, our goal is to create a relationship like below so that we can use the age band in visuals.
Power Query Merge Between
In Power Query, when you Merge two tables, the merge operation is always based on values being equal. Unless you use Fuzzy matching. The fuzzy matching is not based on exact equal, but it is based on a threshold close to the equal anyway.
This means you cannot merge two tables based on saying if the field Age of the Sample data table is between the fields Start and End in the Age band table. But there is a trick to do that, let’s see how it works.
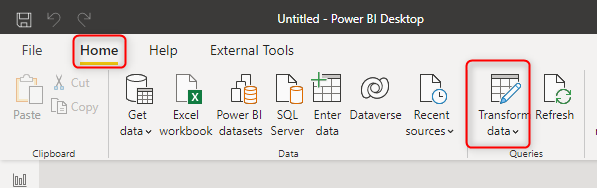
Before starting this, you have to go to Power Query Editor window using the Transform Data in Power BI Desktop.
Reference table from the Age band
Doing merge-between operation in Power Query is not complicated, I have explained once, how you can do that with date fields. You can use a similar approach here. The very first step is to create a reference from the age band table. We do need to create the reference because we are changing the structure of this table and will be using this new table to merge back to the main table.
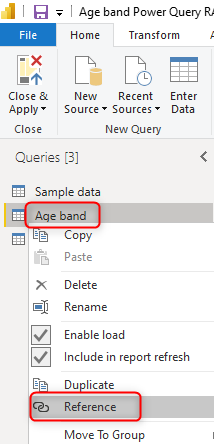
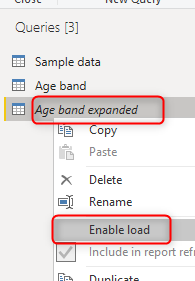
Once the reference is created, you can name it as Age band expanded, and disable the load of it (this is a temporary table that will not be loaded directly into Power BI)
Expand the age range
In the age band extended table, you need to create one row per age. That is why I call it expanded table. To do this, we need to create a list of numbers from the Start to the End in each row, and then expand it.
In Power Query, you can create a list using the formula below;
{<start number>..<end number>}This will create a list from the start number to the end number incrementing one number each time.
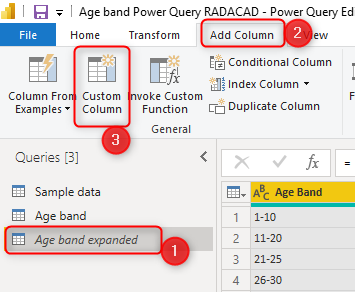
Add a new custom column to the Age band expanded table
Set the custom column name to Age, and in the formula write the below expression;
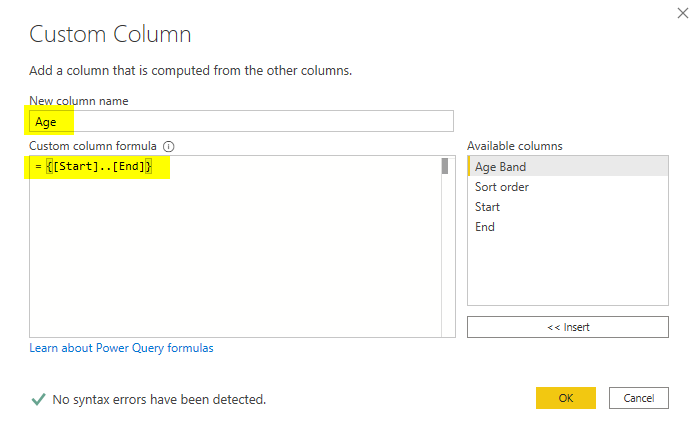
This will create a list of numbers for each row, from the Start to the End
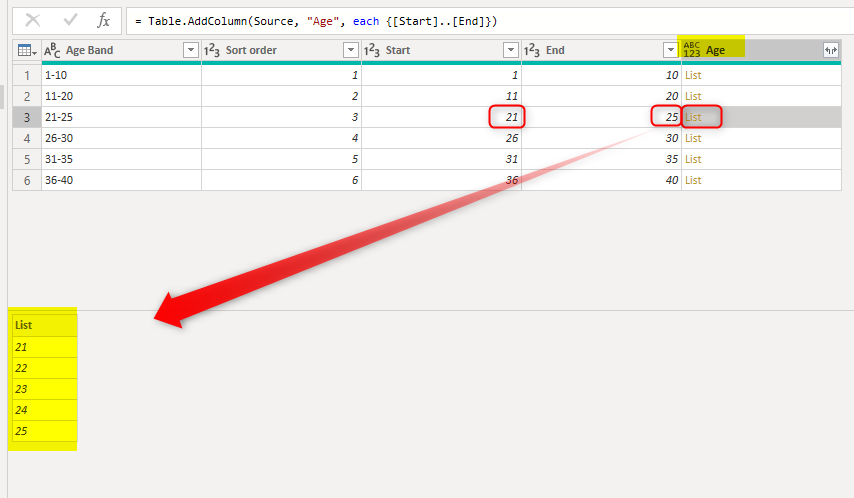
This means you can click on Expand on the new Age column and expand it to new rows
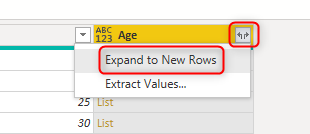
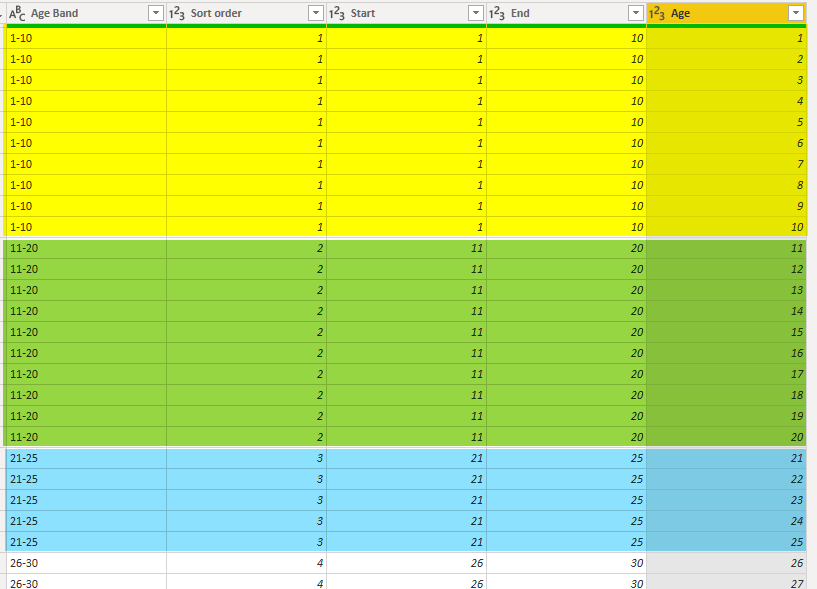
Once the expansion is done, your age band expanded table looks like below with one row for each age.
Merge with the main table
The Age band expanded table is now ready to be merged to the main table. In my case, the Sample data table can be merged into this table
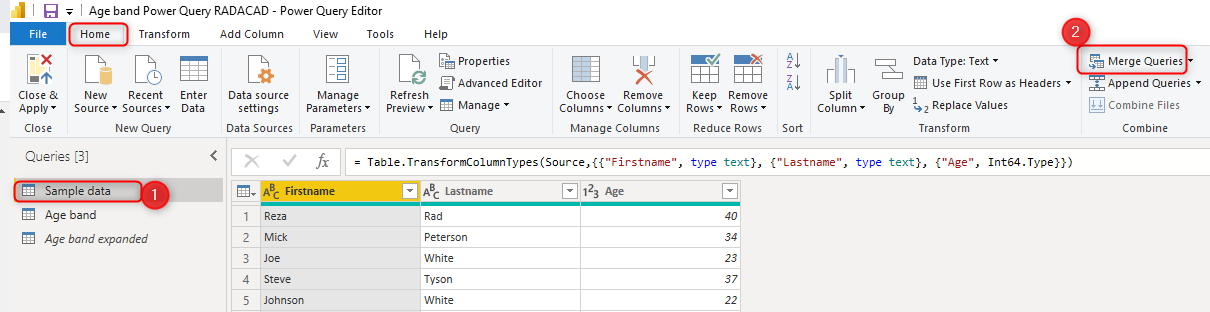
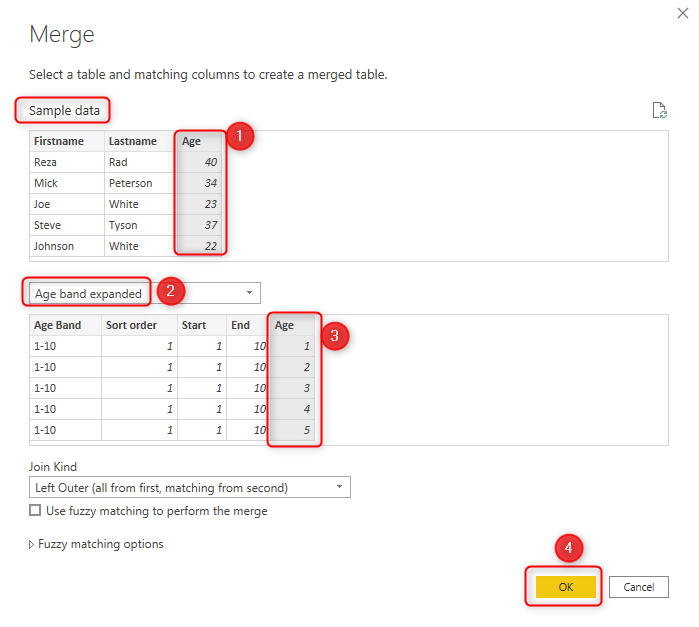
In the merge queries window, merge the two tables based on the Age column.
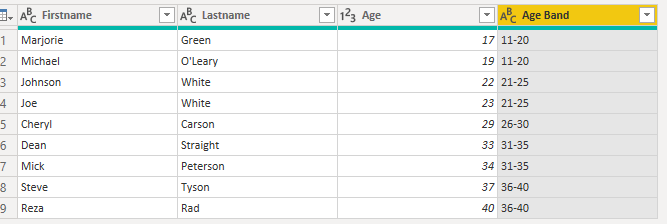
Finally, the created table in each row can be expanded to reveal the age band of each row. You won’t need other columns, because we will still create a relationship to the age band table once loaded into Power BI and will have access to the columns of that table.
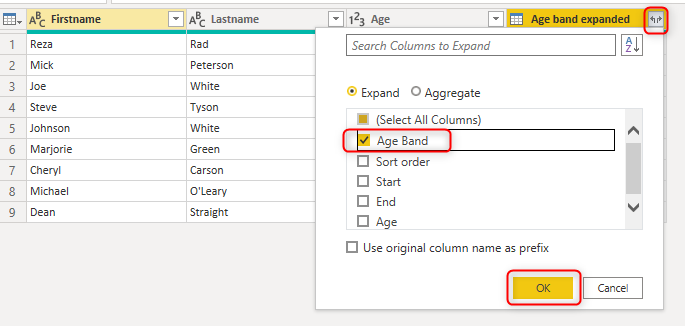
The data of the table now will have the age band in it;
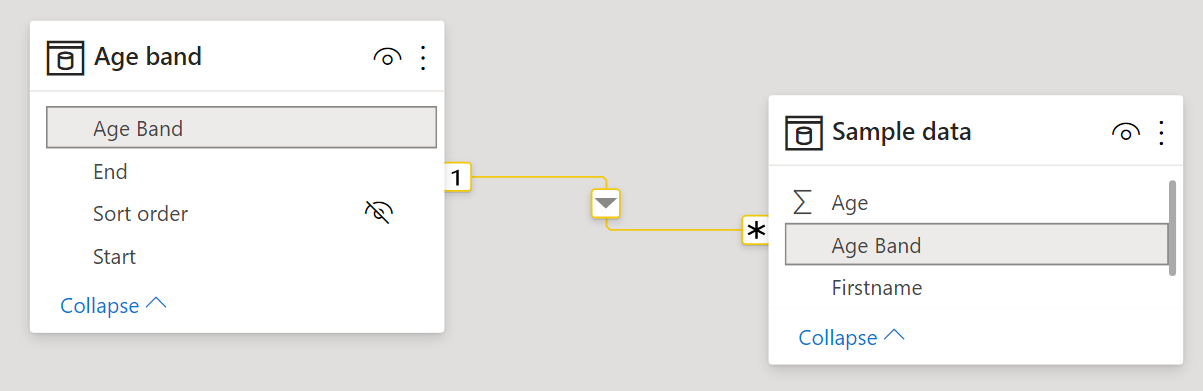
Relationship and Modeling
You may just need the Age band column in the main table, and nothing else. In that case, you don’t even need to load the Age Band table. However, based on my experience, often you will need more than just a column. You may need to have the order of age bands (sort order column), or some other columns explaining something about that age band. that is why you may need to load the Age Band table into Power BI and then create a relationship to the main table based on the Age Band.
You can also sort the Age Band column by the Sort Order column and then hide the sort order column.
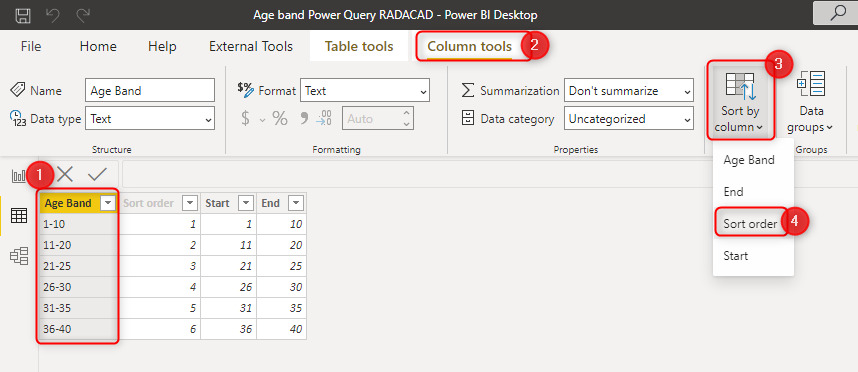
After doing all these, you can visualize the data in a Power BI report
Summary
The method explained here was static age banding with custom band settings. Each age band can have a different start and end. some bands might be smaller or larger than others. We used the Power Query Merge operation to create a connection between the main data table with the age band table. You learned a trick in Power Query to implement a merge based on BETWEEN.
Other articles about age and age banding
I strongly suggest reading other articles below about age or age banding in Power BI to learn more on this subject;
- Age Calculation in Power BI using Power Query
- Age in Years Calculation that works for Leap Year in Power BI using Power Query
- Grouping and Binning; Step Towards Better Data Visualization
- Create Customized Age Bins (or Groups) in Power BI
- Age Banding in Power BI Using TREATAS DAX Function – Relationship Based on Between
Download Sample Power BI File
Download the sample Power BI report here:


Reza is author of more than 14 books on Microsoft Business Intelligence, most of these books are published under Power BI category. Among these are books such as Power BI DAX Simplified, Pro Power BI Architecture, Power BI from Rookie to Rock Star, Power Query books series, Row-Level Security in Power BI and etc.
He is an International Speaker in Microsoft Ignite, Microsoft Business Applications Summit, Data Insight Summit, PASS Summit, SQL Saturday and SQL user groups. And He is a Microsoft Certified Trainer.
Reza’s passion is to help you find the best data solution, he is Data enthusiast.
His articles on different aspects of technologies, especially on MS BI, can be found on his blog: https://radacad.com/blog.