
Power BI has the built-in feature of creating binning for a numeric field such as age. However, the default binning will create bins of equal size. If you want to create bins of different sizes, then you need to create that as a custom column. Fortunately, Power Query has transformations that can help. In this article, I’ll explain how you create customized age bins in Power BI.
Video
Sample data
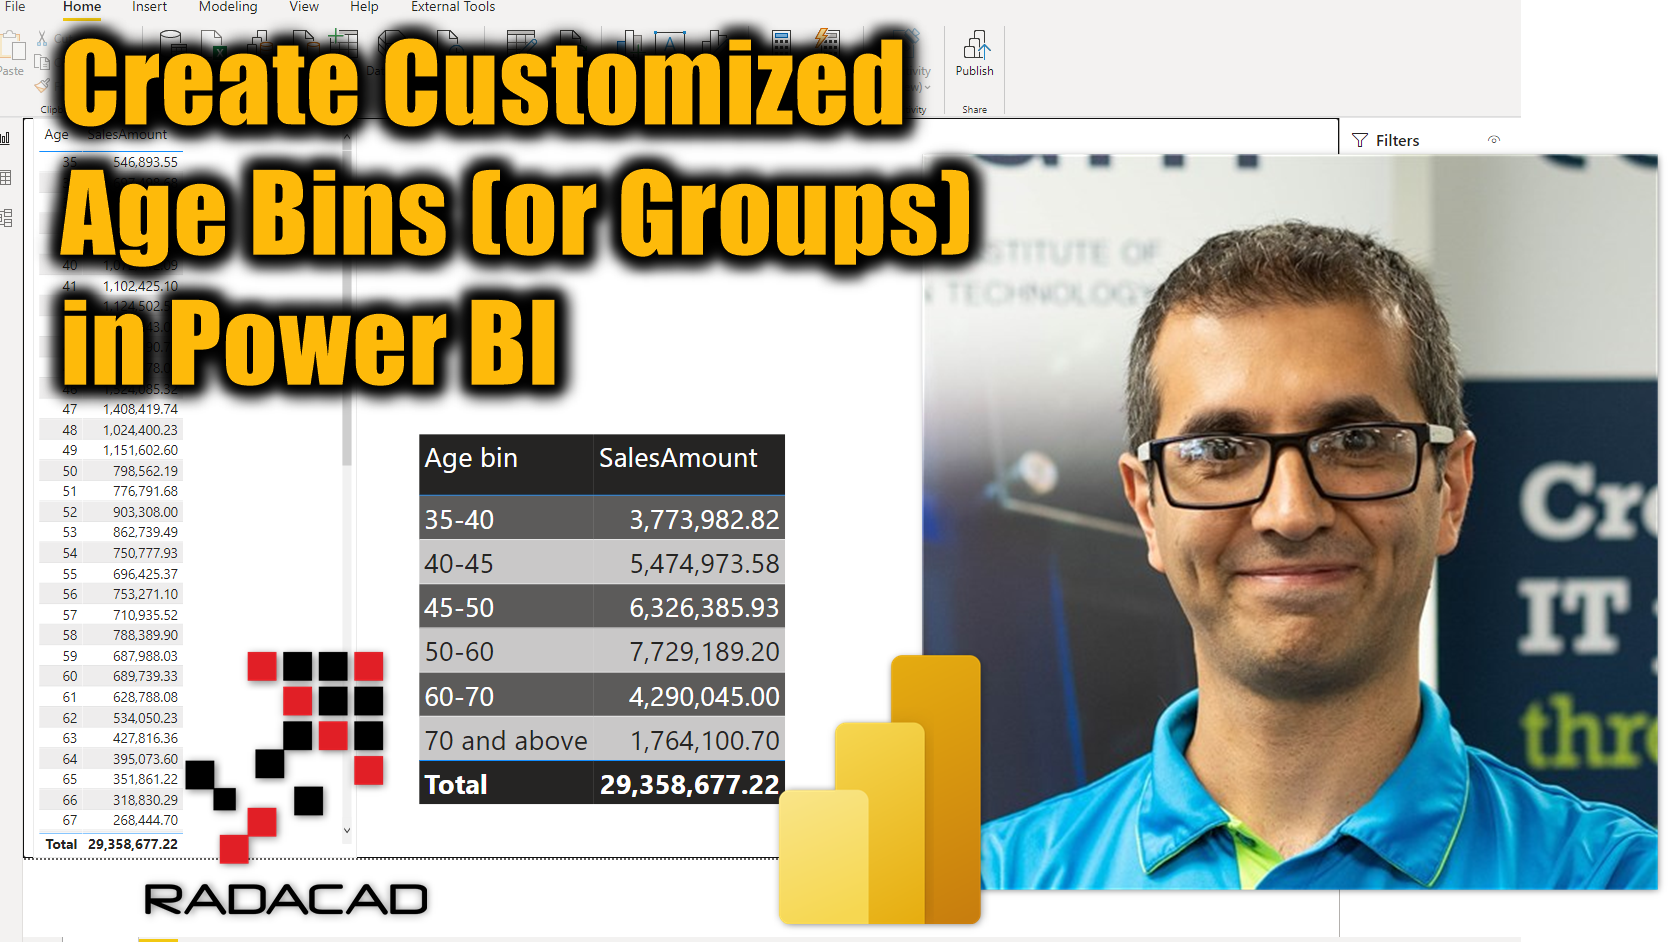
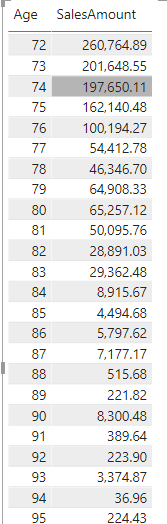
The sample data table which I use here, has ages from 35 to 105. These are ages of customers, and besides it I have the sales amount generated from those customers.
The ages of this data table are calculated from a birthdate column, using the method that I mentioned here. I recommend reading about it if you first need to calculate the age.
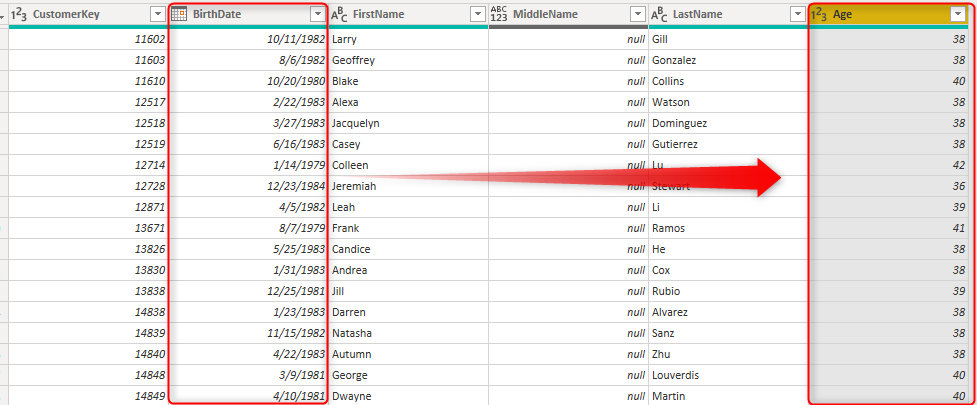
Follow this article to learn more about it:
The required report
I want to have a visual that shows age bands like below with the total sales amount from each;

As you can see bins are in different sizes, from bins of five years apart (such as 35-40), to bins with 35 years range (70 and above).
The built-in binning in Power BI
One of the first stops for binning and grouping in Power BI is the built-in functionality to do that. But the problem with that method is the the bins created using this approach will have similar sizes. If you like to know more about binning with equal sizes, check out my article here;
Dynamic binning using DAX measures
I also explained another example of binning using DAX measures in two separate articles, in one you can choose the size of the bin, and in another one you can choose the number of bins. Both of these methods are useful when you want to dynamically change the bins.
Choosing the count of bins dynamically using DAX measures
Choosing the size of bins dynamically using DAX measures
The method we want to use here can be much simpler, and doesn’t require DAX calculation. It can be done using a conditional column in Power Query.
Power Query Conditional Column
Conditional column in Power Query is a way to create a new column based on some conditions. The conditions can come from expressions that take other columns into consideration. I have explained in detail how the conditional column can be used in this article:
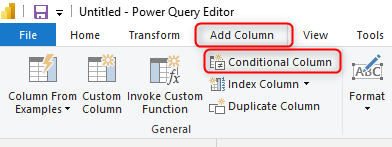
We are going to use the same approach here. You can go to the Transform Data to get the Power Query Editor open.
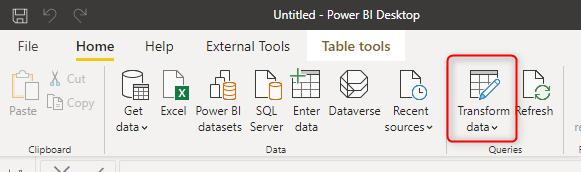
Then click on Add column, and then Conditional Column.
The conditional column graphical interface is simple and powerful to use. You can for example set conditions like below;
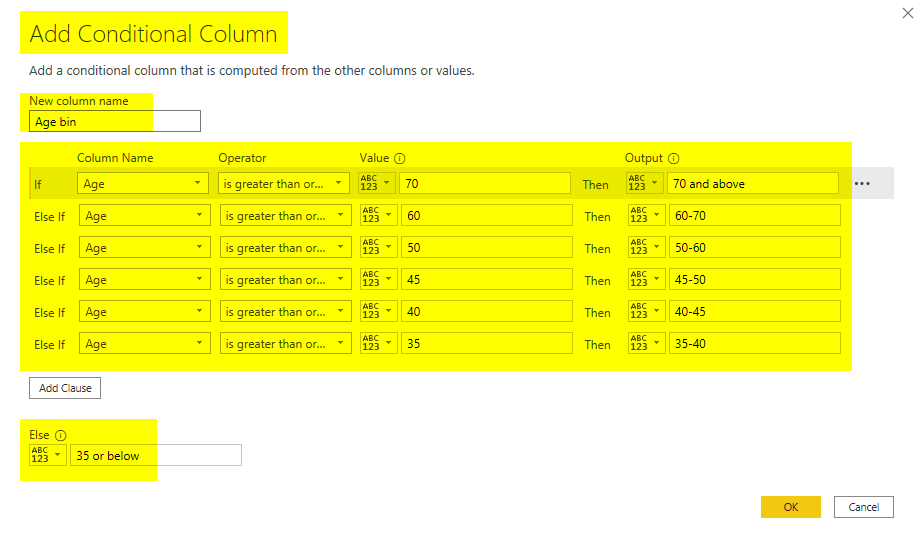
You may ask; “what we don’t use age is greater than X and also less than Y? wouldn’t this double count some?” The answer is no. You don’t need that for this calculation. There is an important part in the calculation and that is the ORDER of conditions and ELSE in the condition.
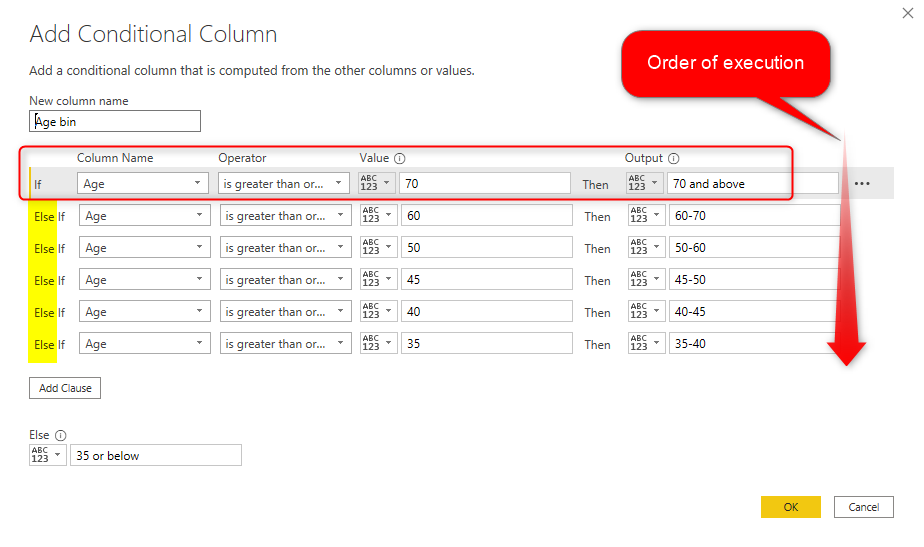
In the example above, the first condition to check will be if the Age is greater than or equal to 70. If there is someone with the age of 72, it will be definitely in this group, but not someone with the age of 65. Then the next condition will be checked for only the group that did not meet the previous condition. That is why we have ELSE If. I have more explanation about how it works in this article if you are interested.
Once you created the new column, you can load the results into Power BI using Close and Apply in the Power Query Editor, and then use the new Age bin column to visualize the data
Sorting
If your Age bin values are not sorted in the way you want it, then you need to add a sort order column to the solution. I have explained that method here in the article below;
Summary
In summary, there are many different ways of doing age binning in Power BI. Depends on if you want equal size bins, or custom sized, if you want the solution to be dynamic or static, there are different methods for it. In this article, I explained how to use the conditional column in Power Query to create static but custom variable sized age bins in Power BI. I do recommend to read articles below as further study options:
- Age Calculation in Power BI using Power Query
- Grouping and Binning; Step Towards Better Data Visualization
- Age Banding in Power BI Using TREATAS DAX Function – Relationship Based on Between
- Dynamic Banding or Grouping in Power BI – Using DAX Measures – Choose the Size of Bins
- Dynamic Banding or Grouping in Power BI – Using DAX Measures – Choose the Count of Bins
- Conditional Column in Power BI using Power Query; You can do anything!
- Sort a Column with a Custom Order in Power BI


Reza is author of more than 14 books on Microsoft Business Intelligence, most of these books are published under Power BI category. Among these are books such as Power BI DAX Simplified, Pro Power BI Architecture, Power BI from Rookie to Rock Star, Power Query books series, Row-Level Security in Power BI and etc.
He is an International Speaker in Microsoft Ignite, Microsoft Business Applications Summit, Data Insight Summit, PASS Summit, SQL Saturday and SQL user groups. And He is a Microsoft Certified Trainer.
Reza’s passion is to help you find the best data solution, he is Data enthusiast.
His articles on different aspects of technologies, especially on MS BI, can be found on his blog: https://radacad.com/blog.