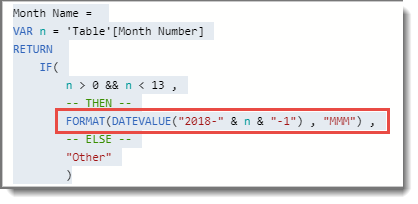
RADACAD Blog

Latest Power BI and AI articles from RADACAD team

Add Photos to Power BI from Active Directory

If you work for an organisation that stores thumbnail images of staff inside Active Directory, you can probably access these and incorporate the images in your Power BI Reports.  This is a great way of making an internal staff report look fantastic – and it’s easy! Step 1. Click Get Data from the Home tab Read more about Add Photos to Power BI from Active Directory[…]

Azure ML Package-Publish a Web service from R-Part2

In the last post, I have explained, how to use AzureML package with the aim of exploration of Azure ML studio experiments and datasets inside R studio environment. moreover how we can use this package to upload a dataset from R studio into Azure ML has been shown. In this post, I am going to Read more about Azure ML Package-Publish a Web service from R-Part2[…]

Power BI Announcements in Data&BI Summit 2018 Dublin Keynote

I am seating in the front row of keynote for Data and BI Summit 2018 in Dublin ran by Dynamic Communities. There will be some great announcements today about upcoming Power BI features. Here in this blog post I will list these features. Incremental Refresh The most wanted feature of Power BI for refreshing data Read more about Power BI Announcements in Data&BI Summit 2018 Dublin Keynote[…]

Run R codes in Azure ML

  There is a possibility to run R codes and Python in Azure ML.  In this short post, I am going to show you how we can run an R codes to show some charts in Azure ML with ggplot2 package. I have a dataset about the dairy product in the USA. this dataset holds Read more about Run R codes in Azure ML[…]

How to use RANKX in DAX (Part 3 of 3 – The Finale)

Part 1 of 3 Using RANKX in calculated measures Part 2 of 3 Using RANKX in calculated columns This article concludes my epic series detailing how to use the RANKX function in DAX.  In this episode, Frodo finally reaches Mt. Doom and successfully uses RANKX to find the best path into the mountain and complete Read more about How to use RANKX in DAX (Part 3 of 3 – The Finale)[…]

Azure ML Package-Part1

Azure ML Package is another Microsoft related package that allows you to upload and download datasets to and from AzureML, to interrogate experiments, to publish R functions as AzureML web services, and to run R data through existing web services and retrieve the output. Azure ML in R studio The first step- Installation First, you need Read more about Azure ML Package-Part1[…]

Microsoft SQl Server ML Services: RevoScaleR Package

  RevoScaleR Package RevoScaleR is packages created by Revolution Analytics (own by Microsoft) with the aim of importing, transforming, and analyzing data at scale. There are different categories of functions for the data store, imports and save as, data transformation, draw some charts such as histogram, line and so forth, descriptive analysis, predictive analysis, package Read more about Microsoft SQl Server ML Services: RevoScaleR Package[…]

Power BI Export to Power Point: Things You Need to Know

Exporting a Power BI report to PowerPoint is a good way of integrating these two tools together. The analytical power of Power BI combined with the commentary and presentation features of PowerPoint enables you to present your reports differently. You can export almost any Power BI report (limitations mentioned in this post) to PowerPoint, and Read more about Power BI Export to Power Point: Things You Need to Know[…]

How to use RANKX in DAX (Part 2 of 3 – Calculated Measures)

The first article in this series looked at to use the RANKX function in a calculated column to apply ranking to your data. This article will show how you can use the RANKX function in a calculated measure. The PBIX file used for this article can be downloaded here. I will use the same 10-row data-set and Read more about How to use RANKX in DAX (Part 2 of 3 – Calculated Measures)[…]

Usage Metrics or Do It Yourself Power BI Monitoring Report

One of the features of Power BI Service is usage metrics report on a dashboard or report. The usage metrics report will give you an analysis of how many times the content is viewed or share, through which platforms, and by which users. You can also create your own monitoring report based on the model Read more about Usage Metrics or Do It Yourself Power BI Monitoring Report[…]