
Dimensions and Fact tables are the two essential parts of building a data model, and their relationship in the form of Star Schema is the best practice of doing the modeling. However, these are all theories until you really experience it in a real-world example. In this article, I want to put everything you learned in the past few articles of Power BI Back to Basics Modeling series into practice, and show you how we can design a star schema for a dataset. I will be using the movies dataset for this example. If you like to learn more about Power BI, read Power BI from Rookie to Rock Star.
Prerequisite
There is no prerequisite for this article. However, I highly recommend you to read below articles beforehand;
What is the Cardinality of the Relationship?
What is the Direction of the Relationship?
Data preparation; First and Foremost Important task
What is a Dimension table and why say No to a single big table
Basics of Modeling in Power BI: Fact Tables
Combining Dimension Tables in Power BI using Power Query; Foundation of Modeling in Power BI
Star Schema and How to Build It
Creating a Shared Dimension Using Power Query and Power BI
Sample Dataset
The sample dataset used here is coming from two sources;
Some Data cleanup is needed for these datasets, which I have explained in another article here.
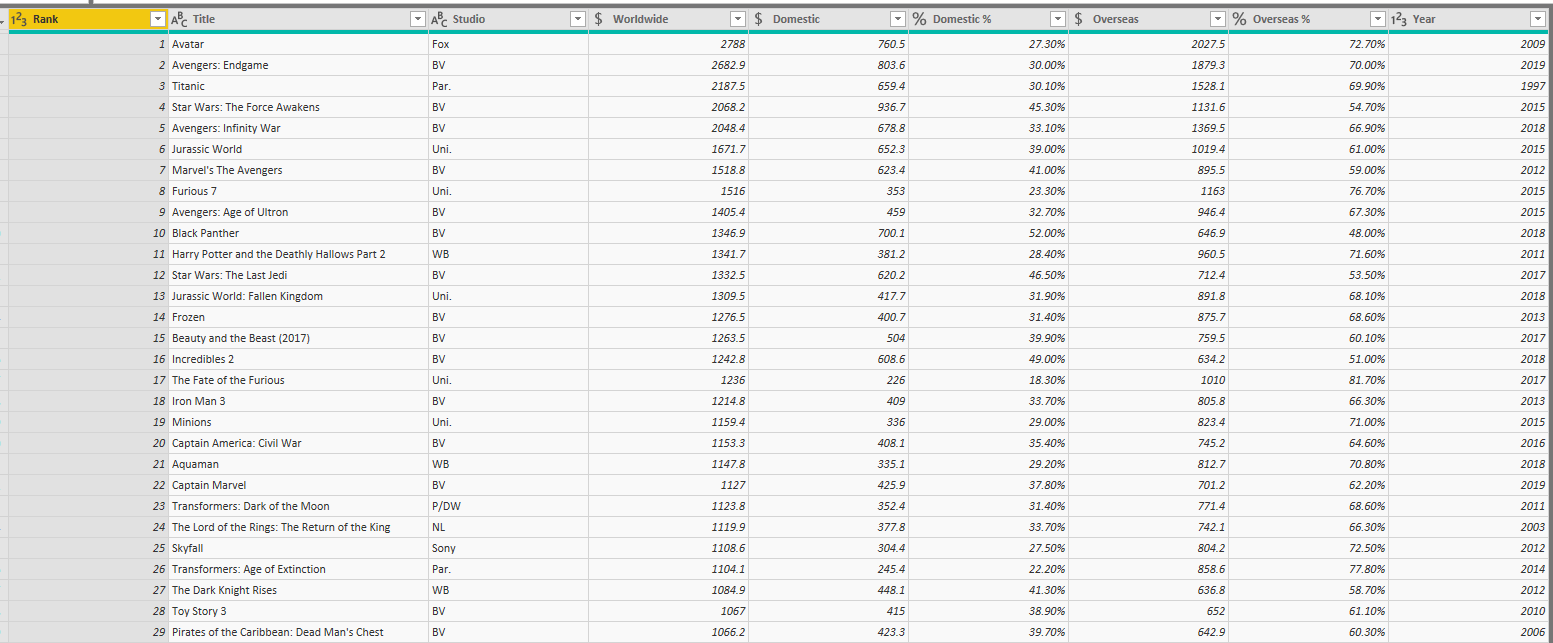
Movies Sales information is a data table like this:
Not Everything in One Table
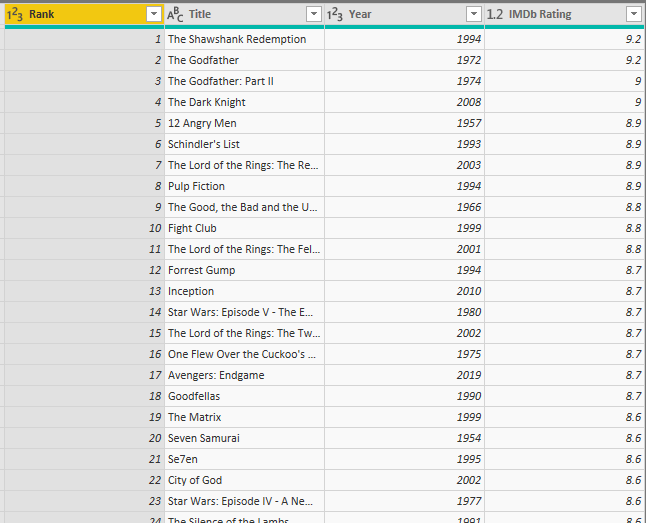
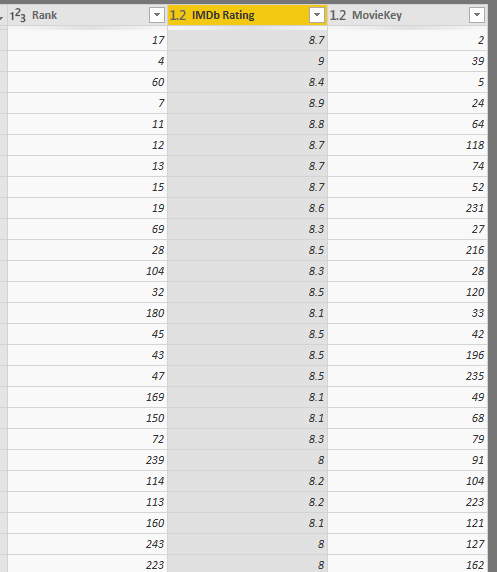
Let’s start the modeling. The table of Movies Sales as you see in the above screenshot has everything in one table. It is obvious that you can load it into Power BI, and start slicing and dicing and building visuals based on it, and it would work fine. However, That is where all mistakes start. If you load this table as is, into Power BI, and after a few months, you realize that you also have another table somewhere. Such as the IMDB Rating table below (let’s call the table as Movies Rating);
Most of the time the problem appears first when you want to slice and dice both tables by one field. Let’s say, you want to see the average rating of movies in a year, and also see the total sales of movies in that year too. Because values are in two different tables, you need to create a relationship. and for creating the relationship, you do need to have a table with unique values of that field otherwise, you might create a many-to-many relationship, which also might need a both-directional relationship. You get into a lot of troubles that would not happen if you had shared dimensions.
The process above is itself complicated just between two fields between two tables. Think that what if you also want to have Movie title as the common slicing and dicing field. What if there is also a third table? This can easily become the headache, and all of that frustration happened because we loaded the initial table just as is, without doing modeling in it. So, it is fair to say again that: There is No Single table of Data. You have to build a Model for it.
There is No All in One Single table model, You have to Build the Model for it.
Fact Table
There is “Single-table” data model, so let’s break our table of Movies Sales into Fact and Dimensions. For a reference, here is the Movies Sales table again;
Facts are all numeric values that might be aggregated at some stage. For example, facts in this table are: Worldwide (sales), Domestic (sales), Domestic %, Overseas (sales), Overseas %, Rank can be a fact, and also can be a dimension. Let’s leave that for now in the fact table. The fact table usually is build based on the existing main table that we have, so we can call the Movies Sales table as FactMoviesSales.
FactMoviesSales will have these facts in it:
- Worldwide (sales)
- Domestic (sales)
- Domestic %
- Overseas (sales)
- Overseas %
- Rank
Dimension Tables
On the other hand, there are fields that we use as Slicer, filter, or axis of our visuals, such as Year, Title of the movie, and Studio. Now that you know what are descriptive fields, you can derive dimensions from it. However, not all of those fields into one single dimension. Not every single field into their own dimension too. Both are wrong. You should find out which fields together can build a dimension.
Descriptive Fields are:
- Year
- Studio
- Title
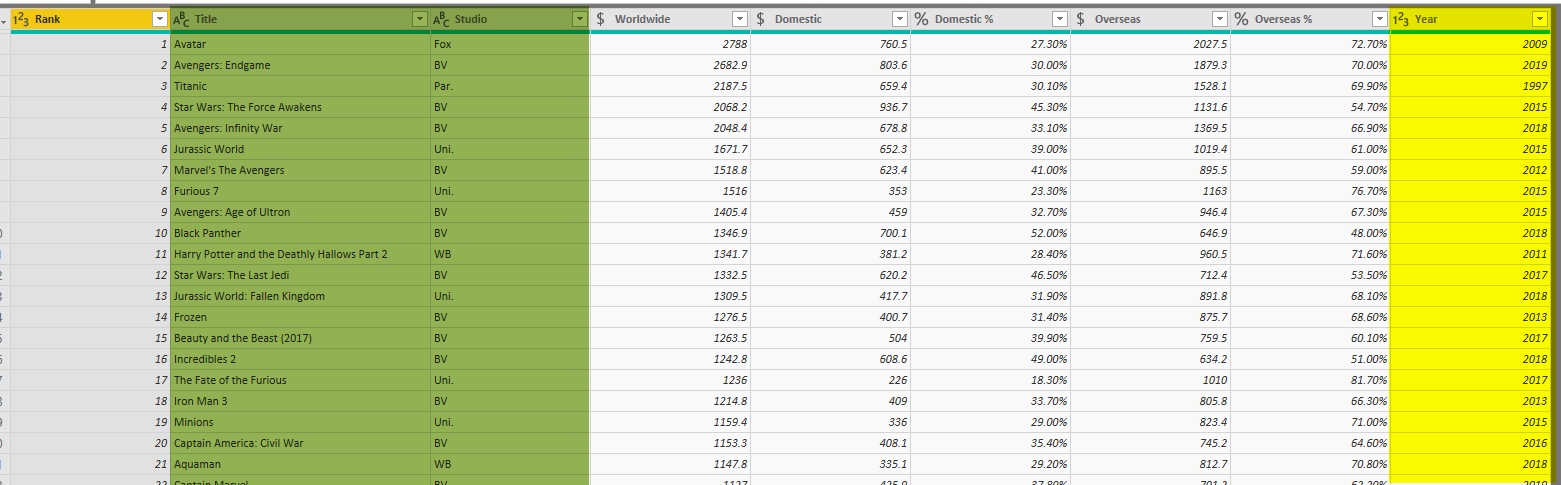
If a movie is made in multiple years, then there will be multiple instances of movies for a year. on the other hand, the year of the production of a movie is part of the movie attributes anyway. Also, the Studio that the movie produced in it is another property of the movie. so we need a Dimension table with all of these three fields in it. Please note that not always you get all descriptive fields combined in one dimension. This depends on the scenario.
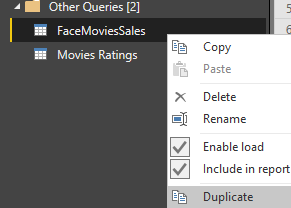
To build the Movie Dimension, you can create another copy of the fact table, this can be done using the Duplicate (Not reference, because we might need to merge this table back to the fact table later on).
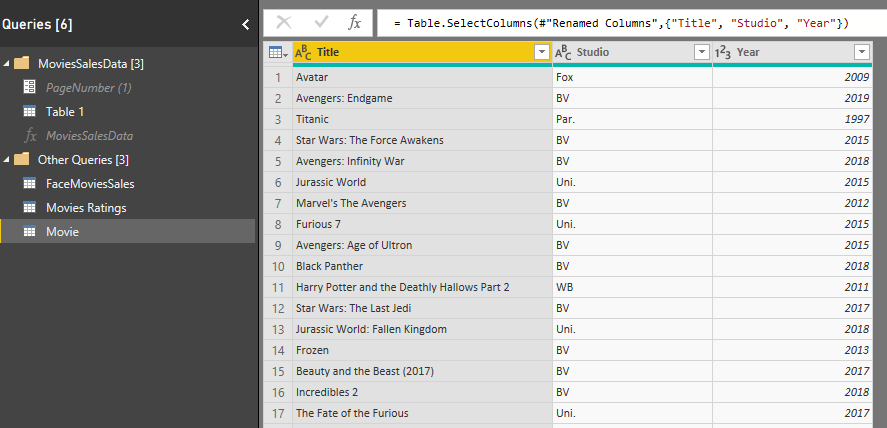
The new Movie Dimension, which I’m going to just call it Movie, will have only the three descriptive fields. You can remove all other fields.
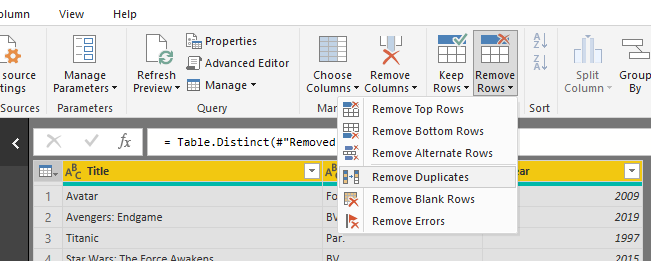
You also need to make sure that your dimension table doesn’t have duplicate entries. so select the combination of all three fields, and then Remove Duplicates.
Note that in Power Query, Remove duplicates is sensitive to the upper case and lower case, and also characters such as space at the beginning or end of the text values. This article explains pitfalls you might fall into when using Remove Duplicates and how to avoid them.
After doing all these actions, you have the Movies dimension ready. However, there is still one more step left.
Linking Dimension(s) and Fact Tables
When you bring multiple tables into Power BI, you will need to create a relationship between those, and the relationship can be only created based on One field in each table. In our case, we have three fields to connect to (Title, Studio, and Year). We need to create a single field for the connection. There are two methods to do that; one is to create a Key column for the dimension table, this can be an auto number or Index. Another is to create a concatenated field. Because Power BI, at the end of the day, will apply compression on the fields, there are not many differences between the two methods above in this example. However, if you have a really long text field, that the concatenation would cause some issues, then key column can be a better approach.
Concatenating fields is easy. So I show you the method of Key Column instead. I add a new Index column to the Movie table;
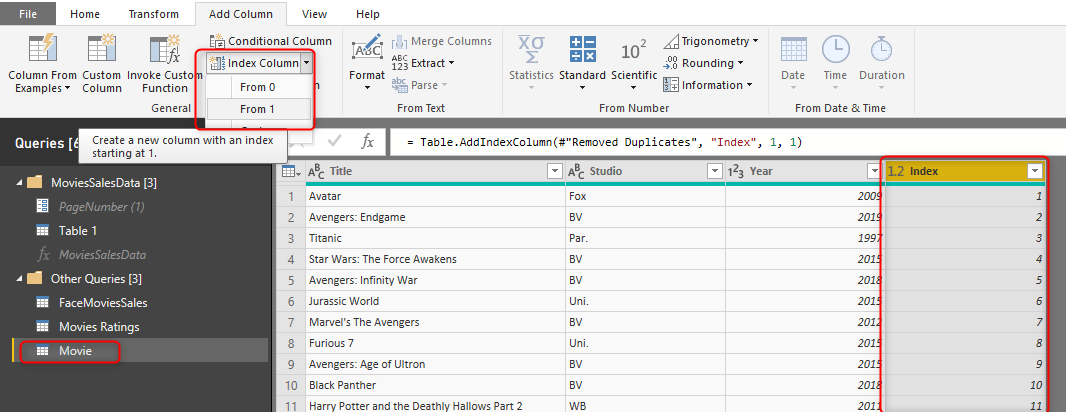
This column is going to be what we call as Surrogate Key in the Dimension table. or let’s call it MovieKey.
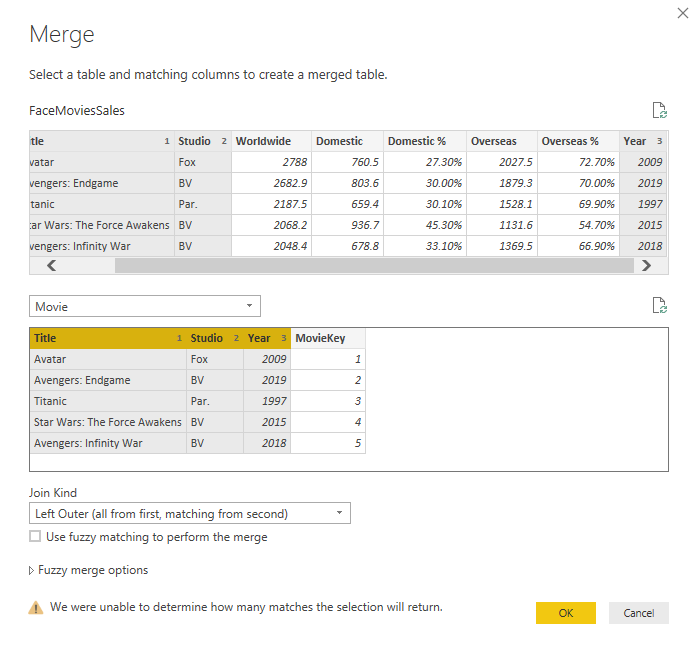
The next step would be bringing the MovieKey into the FactMovieSales table too. For that, we use a Merge from the FactMovieSales table to Movie table, based on the three fields of Title, Studio, and Year (in the same order in both tables);
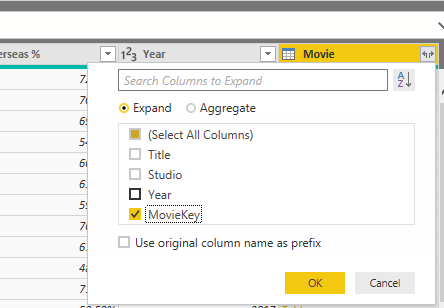
After the Merge, we can fetch the MovieKey from the Movie table to expand.
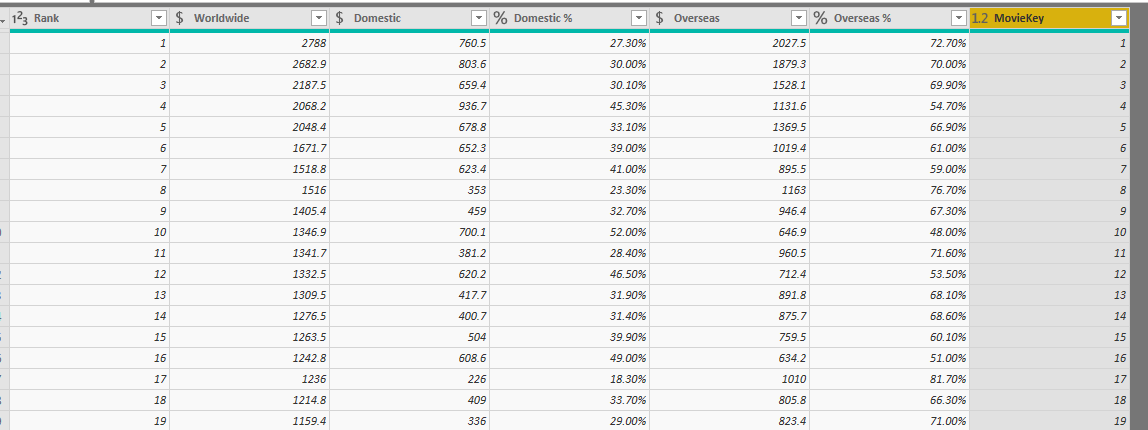
And then you can remove the three fields you used for the join from the FactMovieSales table. This is what your FactMovieSales will look like;
Note that there are a LOT of details that I skipped in this example for simplifying the process. for example, you have to take care of all these;
- Making sure you have unique combinations. If you get multiple records from the Movie table for one row in the fact table, then you need to investigate why, and you might need to change the combination of fields in the dimension table then.
- If there are blank/null values in the MovieKey column, you need to investigate why it didn’t found match row.
- When you combine this with other tables, you need to make sure that the Movie table is maintained as a master list, which is a big topic for itself.
- …
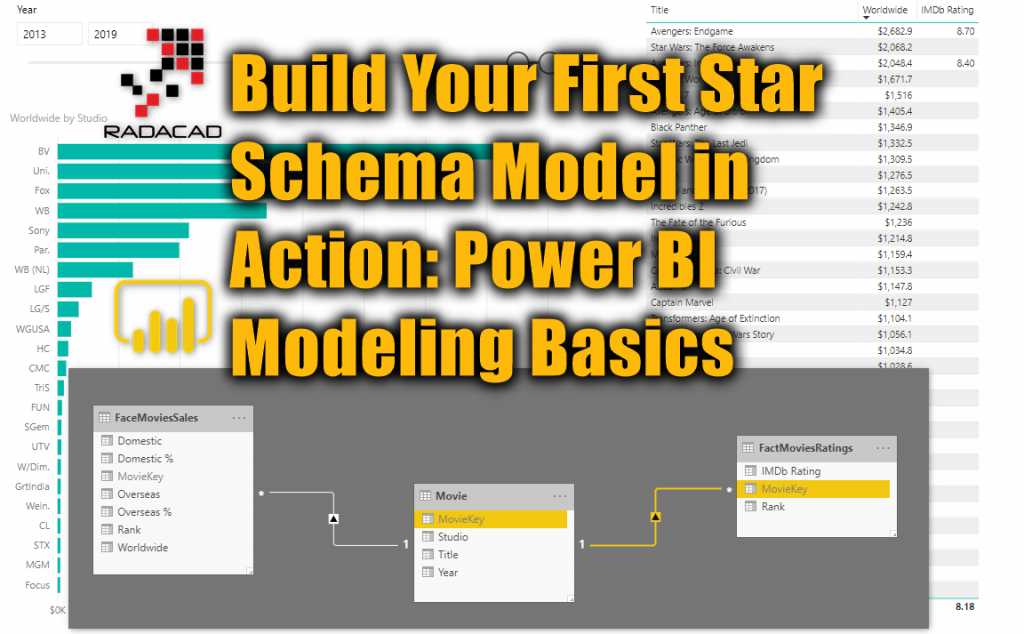
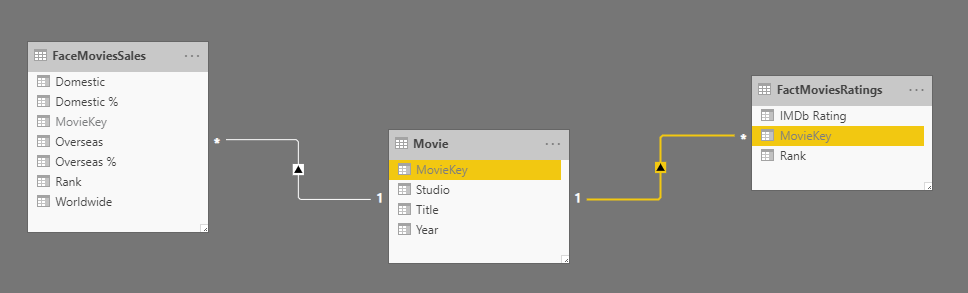
Now you can load these two tables into Power BI and create a relationship between them based on the MovieKey. As you notice in the below screenshot, the MovieKey is hidden, because it is a technical field, and the user doesn’t need to know about it at all.
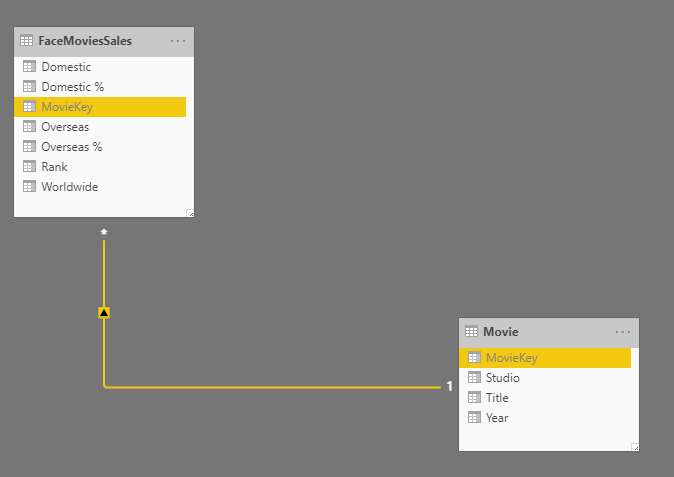
Make sure the relationship between the fact table and dimension tables are always one-to-many and single-directional from the dimension table to the fact table.
So here you go, now you have a star schema. It is at the moment just one fact table and one dimension, but it is a star schema.
Adding More Tables
The main benefit of the Star Schema is visible when you add more tables into that. For example, now if I bring the Movies Rating table, which looks like below:
Then we can connect it to Movie dimension. However, because the Movie dimension is not yet a master list and doesn’t have all movies in it, you might need to merge the list of movies into there and create one master list. I explained a bit about a process like this in How to create a shared dimension using Power Query and Power BI.
Bringing the MovieKey in the FactMoviesRating would make the table like the below screenshot;
Loading this table also into the Power BI will result in another fact table related to the Movie dimension
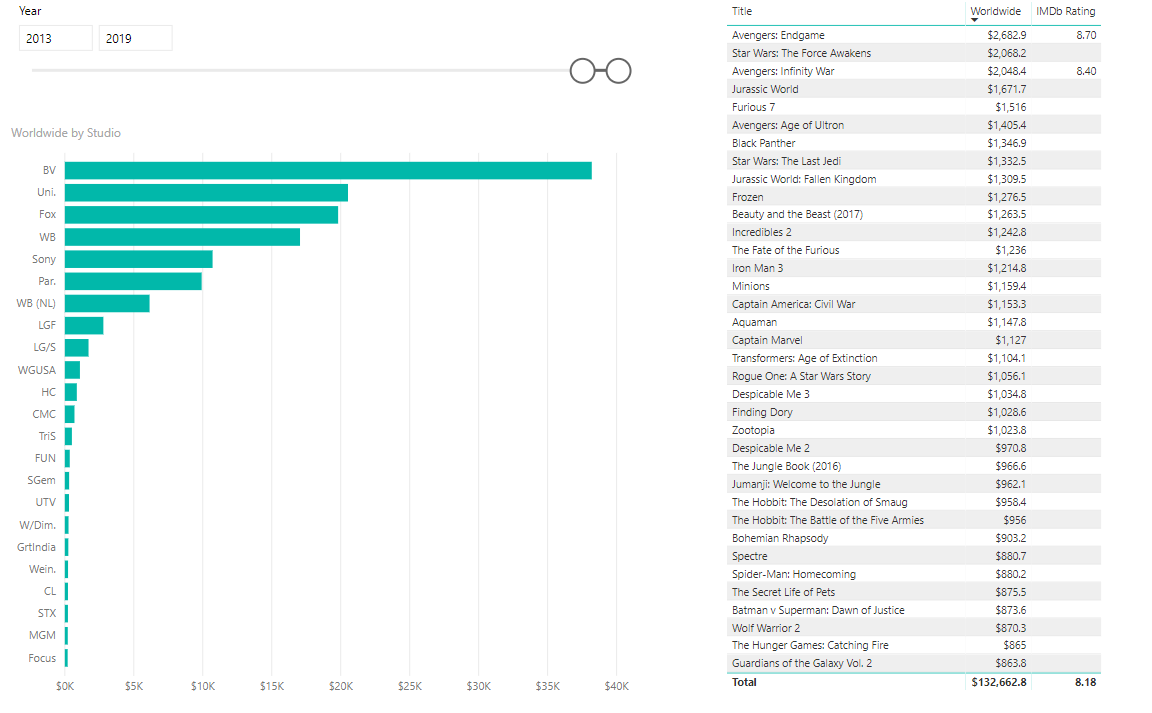
You can then add more dimensions and fact tables later into this model, and extend the model to be always a star schema. Now with the power of star schema and shared dimensions, I can easily build visualizations like below without the need for bi-directional or many-to-many relationships or extra calculations.
Summary
Building a star schema design is not an easy job, It will take time. Probably 70% of your time in developing a Power BI solution is spent on building your data model using Power Query. This article was a quick run through some of the principles and concepts that you have learned in the previous set of articles in the Back to basics of Power BI Modeling. As you have noticed, It is not possible to explain every single step in full details, It might end up being 10 or more articles for such a small example. However, I explained the main topics and the order of things you need to follow to build your model in the right way. There are still many other details that can be discussed, and I will cover some of those in other articles in the future.
Share your thoughts with me in the comments below, If you have doubts implementing something like this in your implementation, let me know, and I’ll be able to help.
If you like to learn more about other steps, I’ll highly recommend reading other articles in this series;
What is the Cardinality of the Relationship?
What is the Direction of the Relationship?
Data preparation; First and Foremost Important task
What is a Dimension table and why say No to a single big table
Basics of Modeling in Power BI: Fact Tables
Combining Dimension Tables in Power BI using Power Query; Foundation of Modeling in Power BI
Star Schema and How to Build It
Creating a Shared Dimension Using Power Query and Power BI


Reza is author of more than 14 books on Microsoft Business Intelligence, most of these books are published under Power BI category. Among these are books such as Power BI DAX Simplified, Pro Power BI Architecture, Power BI from Rookie to Rock Star, Power Query books series, Row-Level Security in Power BI and etc.
He is an International Speaker in Microsoft Ignite, Microsoft Business Applications Summit, Data Insight Summit, PASS Summit, SQL Saturday and SQL user groups. And He is a Microsoft Certified Trainer.
Reza’s passion is to help you find the best data solution, he is Data enthusiast.
His articles on different aspects of technologies, especially on MS BI, can be found on his blog: https://radacad.com/blog.
Hi Reza
In attempting to create my Tendering model I came across a slicing issue which I solved but only by moving a Text field into my Fact Table. I would appreciate some advice please, and maybe it is a learning opportunity for readers of your blog 🙂
Raw table from .csv file:
────────── ┌─────────┬─────────────┬─────────────┬────────────────┬────────┬─────────┬──────────────────┐
Name: │ RowID │ QuotationNo │ ClosingDate │ Price/Estimate │ Status │ Outcome │ %ChanceOfWinning │
────────── ├─────────┼─────────────┼─────────────┼────────────────┼────────┼─────────┼──────────────────┤
Data Type: │ WholeNo │ String │ Date │ WholeNo │ String │ String │ DecimalNo │
────────── └─────────┴─────────────┴─────────────┴────────────────┴────────┴─────────┴──────────────────┘
RowID is row number from the spreadsheet so I can refer back to it if needed.
My First attempt:
DimTable
┌───────┬─────────────┬────────┬─────────┬───────────┐
│ RowID │ QuotationNo │ Status │ Outcome │ TenderKey │
└───────┴─────────────┴────────┴─────────┴───────────┘
TenderKey is generated from concatenating RowID and QuotationNo – I did have one instance of QuotationNo occurring twice and it was necessary to differentiate them.
FactTable
┌───────────┬─────────────┬────────────────┬──────────────────┐
│ TenderKey │ ClosingDate │ Price/Estimate │ %ChanceOfWinning │
└───────────┴─────────────┴────────────────┴──────────────────┘
I related the DimTable to the FactTable 1:*, Single direction (* on the FactTable side) even though the data results in a 1:1 relationship.
I also created a Calendar table and related it 1:*, Single direction (* on the FactTable side) with the relationship going from Calendar:FullDateAlternateKey to FactTable:ClosingDate
This worked mostly. Except I need to slice the Status by date. That is, the client wants to know, in each closing month, how many tenders were submitted, how many are still in draft & how many were not submitted. So I had the problem that I wanted to slice my dimension table by the Calendar table (another dimension table) which I deduce is not a good idea. So what I did was to move my Status field from my DimTable to my FactTable. This actually works nicely.
But! You state that a Fact Table should contain numeric fields and I am including a text field. Although it works, have I moved away from best practice. And if so, what would be the better solution?
My Second attempt:
DimTable
┌───────┬─────────────┬─────────┬───────────┐
│ RowID │ QuotationNo │ Outcome │ TenderKey │
└───────┴─────────────┴─────────┴───────────┘
FactTable
┌───────────┬─────────────┬────────────────┬──────────────────┬────────┐
│ TenderKey │ ClosingDate │ Price/Estimate │ %ChanceOfWinning │ Status │
└───────────┴─────────────┴────────────────┴──────────────────┴────────┘
Hi Karl.
I didn’t know you can put table formats like this in the comments answer. pretty neat 🙂
What I understand from your requirement, is that you need also a second fact table, which would be a snapshot fact table.
the snapshot fact table will hold information such as
MonthKey (because you are evaluating this at month level) | Count of Tenders Submitted | Count of Tenders draft | …..
You would also need to create a relationship from a Month dimension to this fact table. or if you want to use your date table, then put the monthkey as the first day of each month and then create relationship
another point is that if the number of Status for Tender is a lot, then instead of creating it that way, I do suggest creating a separate dimension for the Status, and building fact table like this:
Monthkey | StatusKey | Count of Tenders
Cheers
Reza
Hi Reza,
I wonder why to use a duplicate of the fact table to create the movie dimension. In your article “Creating a Shared Dimension in Power BI Using Power Query: Basics and Foundations of Modeling” you recommend to use a reference for creating a dimension table out of the fact tables.
Is it because of the remerge to get the created index in the fact table and do I have to use a duplicate of the fact movieratings to create the master list?
Can is use a reference when I use a concatenated column to connect the tables?
Thank you in advance
Ben
Hi Ben
Yes, exactly as you mentioned. Reference is the preference. However, if the newly created table (which is a reference from the main table) is going to be used to Merge back to the main table, then it creates a circular reference problem. That is why here you see I used the Duplicate. I might write about this in a separate article.
Cheers
Reza
Hi Reza,
Just started to work with building in Power Bi and your book and blog posts have been really helpful.
I have the same question as Ben posted in the history. Could you answer the last part of the question ?
In creating the master list do I use a duplicate of the fact movie rating ?
Or do i have to create a ‘new’ pseudo dimensions table for the fact movie rating and then use that together with the
first dimensions table to create a shared dimension ?
Thanks,
Ike
Hi Ike
You can either duplicate/reference the fact table and then append/merge the other table to it. or you can use append/merge as new, which will create a reference from the fact table and then merge it with the other table as a new table.