Dynamic Row Level Security with Organizational Hierarchy Power BI
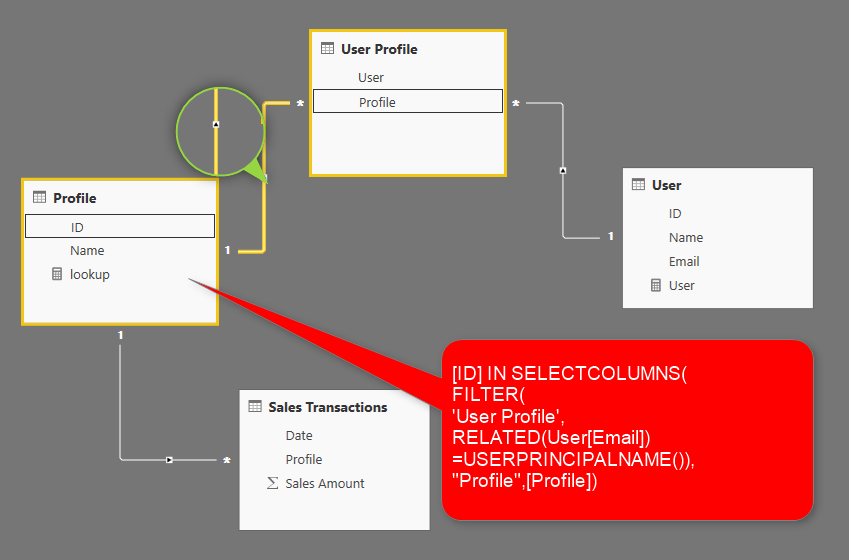
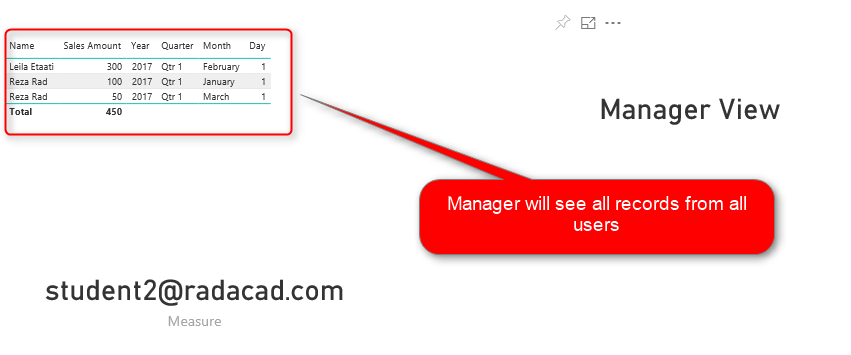
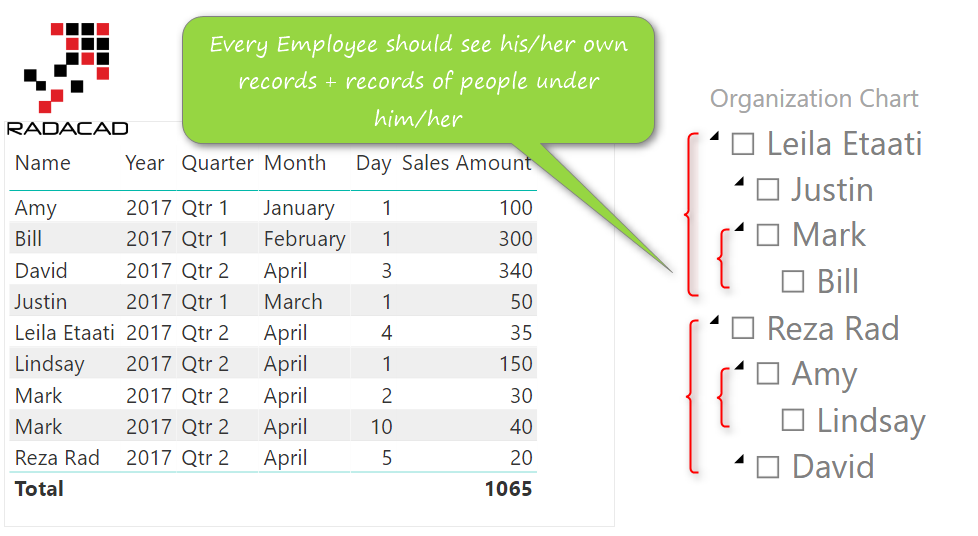
In previous posts, I covered some methods of Dynamic Row Level Security including Row Level Security user based, With Manager Level Access, and also with User and Profiles as a many to many relationships. In this post, I’m going to cover another common scenario for row level security; Organizational hierarchy for security. Through organizational hierarchy Read more about Dynamic Row Level Security with Organizational Hierarchy Power BI[…]