Fun with DAX – Compressing Numeric Sequences to Text
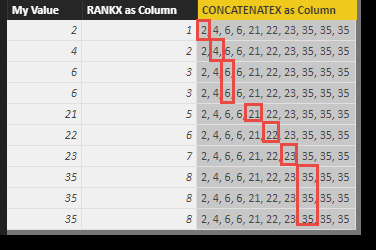
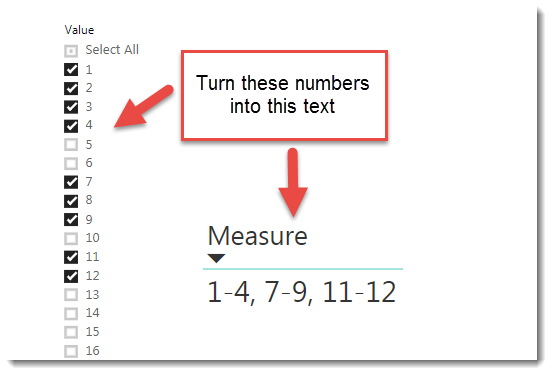
A recent post on the Power BI community website asked if it was possible to compress a group of numbers into text that described the sequential ranges contained within the numbers. This might be a group of values such as 1, 2, 3, 4, 7, 8, 9, 12, 13: (note there are gaps) with the Read more about Fun with DAX – Compressing Numeric Sequences to Text[…]