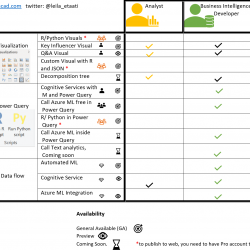
Custom Format Fields and Measures in Power BI

If you have been watching Power BI news recently, you know that Power BI fields now support custom formatting. In this short blog article, I am going to explain how to use this feature to achieve your custom formatting. You can do things like showing () for negative values, showing custom date/time formats, and etc. Read more about Custom Format Fields and Measures in Power BI[…]

From and To Date Slicers in Power BI: Filtering Based on Two Fields

Power BI date slicers can be used to filter based on one field. However, what if in your dataset, you have a FROM and TO (or Start and End) Date? In that case, you’d most probably want to use the slicer to filter the report in such a way that it shows all data in Read more about From and To Date Slicers in Power BI: Filtering Based on Two Fields[…]

Using Data Category to Have a Better Visualization in Power BI

There are some field properties in Power BI such as formatting, which is obvious to use. However, some configurations on the field level, such as Data Category, is not very well known. Data Category is a configuration that can be helpful in multiple visualizations, In this short article, I’m explaining how to use this option Read more about Using Data Category to Have a Better Visualization in Power BI[…]

Find the Best, Worst, and Middle Values Using Simple Clustering with Power BI Scatter Chart

Machine Learning and AI can be advanced areas, however, there are some easy to use methods for that especially in the Power Platform and Power BI. Leila has written tons of blog articles about AI in Power Platform. However, as a visualization point of view, I want to show you a feature that you might Read more about Find the Best, Worst, and Middle Values Using Simple Clustering with Power BI Scatter Chart[…]

Introduction to Charticulator: Create Custom Visual – Part 1

In the last post different ways of creating custom, visuals have been explained. In this post, I will show how to use Charticulator for creating a custom visual in Power BI. As mentioned, first navigate to the below link: https://Charticulator.com Next, you need to click on the Launch Charticulator. This will navigate you to the Read more about Introduction to Charticulator: Create Custom Visual – Part 1[…]

Create Visual/Custom Visual for Power BI: Different Approaches

There is always a need to extend the usage of visuals in Power BI. There are multi ways to do it first using   First Option: Using Standard Panel               Easy to use and available all the time               all tested and reliable     Read more about Create Visual/Custom Visual for Power BI: Different Approaches[…]

Applied more Analytics on your data with Key Influencer Visualization

In this post, I am going to demonstrate a new visualization that has been released by the AI team in Power BI in recent months. Before showing off the nice features, there are some key points about this visual. http://datascientistyuyuria.blogspot.com/2017/06/ It can be used by Data sciences, Data engineer and End users.  It is easy Read more about Applied more Analytics on your data with Key Influencer Visualization[…]

Showing the Total Value in Stacked Column Chart in Power BI

Although very simple, still I get this question very often; How can I show the total value as a data label in a stacked column chart? In this quick blog post, I’m going to show you a quick and easy method to use a combo chart and show the total as a label on top Read more about Showing the Total Value in Stacked Column Chart in Power BI[…]

DAX and Conditional Formatting Better Together: Find The Biggest and Smallest Numbers in the Column

  In the previous article, I explained the importance of Conditional formatting and mentioned that having a table with no color coding is not a proper way of giving information to your users. In this article, as the second step; I’m going to show you how to use DAX combined with conditional formatting to only Read more about DAX and Conditional Formatting Better Together: Find The Biggest and Smallest Numbers in the Column[…]

Show Me the Biggest Number! Conditional Formatting in Power BI

I have given many presentations and talks about Data Visualization, and still, I am amazed by how many visualizations I see which is not following the basic rules. In this article, I want to focus on table visual. A table is a visual that most of us are using it on many occasions, in fact, Read more about Show Me the Biggest Number! Conditional Formatting in Power BI[…]