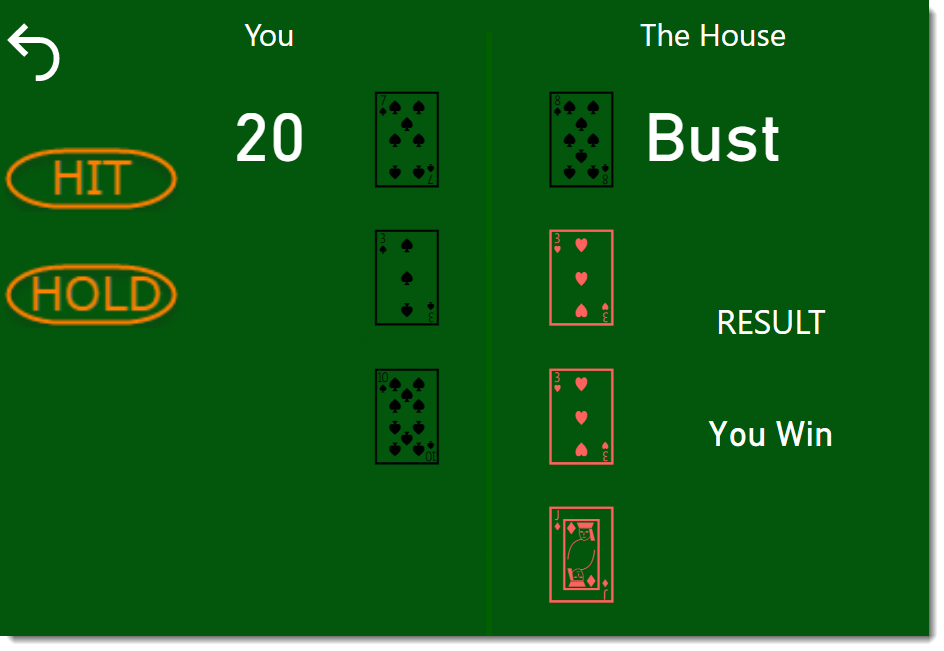
Report Page Tooltip – Revolution in Visualization of Power BI

Very exciting feature that is added in the most recent version of Power BI Desktop March 2018 is Report Page Tooltips. This is a specific type of tooltip which can be a report itself. which this feature you can have your drill down report designed separately, and then with hovering on a chart, you can Read more about Report Page Tooltip – Revolution in Visualization of Power BI[…]

How to use RANKX in DAX (Part 1 of 3 – Calculated Columns)

How to use RANKX in DAX (Part 2 of 3 – Calculated Measures) When I first started to play with DAX, one of the functions that seemed to confuse me more than it should, was how to add ranking to my data.  It didn’t seem to matter what the data was, if I followed the Read more about How to use RANKX in DAX (Part 1 of 3 – Calculated Columns)[…]

Power BI Embedded; Power BI in a Custom Application

Power BI leverages a very powerful method of sharing named Power BI Embedded. This method of sharing is important because of mainly two specific features of it. With this method, you can share Power BI content in your custom application, and you can share it with your custom application users, regardless if they have Power Read more about Power BI Embedded; Power BI in a Custom Application[…]

Power BI Issue Fix: Import from Excel Workbook Contents; Password Protection Failure

One of the great features of Power BI Desktop is the ability to import your entire Power Pivot Excel model into it. This is an awesome feature, because you can import the entire model including tables, relationships, calculations, and hierarchies into the Power BI. This is a great migration feature from Excel to Power BI. Read more about Power BI Issue Fix: Import from Excel Workbook Contents; Password Protection Failure[…]

Unleash Security Patterns in Power BI; Webinar Recording and Materials

Thanks to all attendees of my Power BI webinar last Friday. I hope you all enjoyed it. I explained a number of the most common row level security patterns in Power BI with some DAX expressions, in this post you will find the description of webinar, recording, and link to all demos and materials. Although Read more about Unleash Security Patterns in Power BI; Webinar Recording and Materials[…]

Export the Entire M Power Query Script from a Power BI File, New Version of Power BI Helper, Search based on Field Description in the Model

Previous versions of Power BI Helper had some features related to the visualization part and the modelling part of a Power BI file. This latest release of Power BI helper, can export the entire M or Power Query script into a file or into clipboard. Sometimes, especially when the number of queries in the Power Read more about Export the Entire M Power Query Script from a Power BI File, New Version of Power BI Helper, Search based on Field Description in the Model[…]

Dynamic Date Range from Slicer

A recent post on a community.powerbi.com forum asked if it was possible to show a slicer of months, and configure a report so when a user selects a single month from the slicer, visuals will show data for a date range relative to that selection e.g. the preceding  10 months of data. If a user Read more about Dynamic Date Range from Slicer[…]

Embed Power BI in SharePoint Online; Office 365 Integrated Sharing

In this article, you’ll learn about another method of sharing called Embed in SharePoint online. Embedding in SharePoint online is an excellent method to share Power BI content through a SharePoint portal. Because Power BI and Office 365 accounts are bound to each other, this method of sharing is prevalent for SharePoint users. You can Read more about Embed Power BI in SharePoint Online; Office 365 Integrated Sharing[…]

Creating Machine learning Development and Production Environment in Power BI

  There is need to isolate the development and production environment in most of all projects. Setting up these environments help us to deliver a more reliable product to our customers. Machine learning projects also need a development, Test and Production environment. In this post, I am going to show you how we can do Read more about Creating Machine learning Development and Production Environment in Power BI[…]

Power BI – Banding and stripes in charts

This blog will show a technique that can be applied to certain charts allow banding or stripes to help highlight data. This could be horizontal bands to help show data above or below a certain threshold, or this could be vertical bands to help highlight ranges of data by time.  In both cases, using What-If Read more about Power BI – Banding and stripes in charts[…]