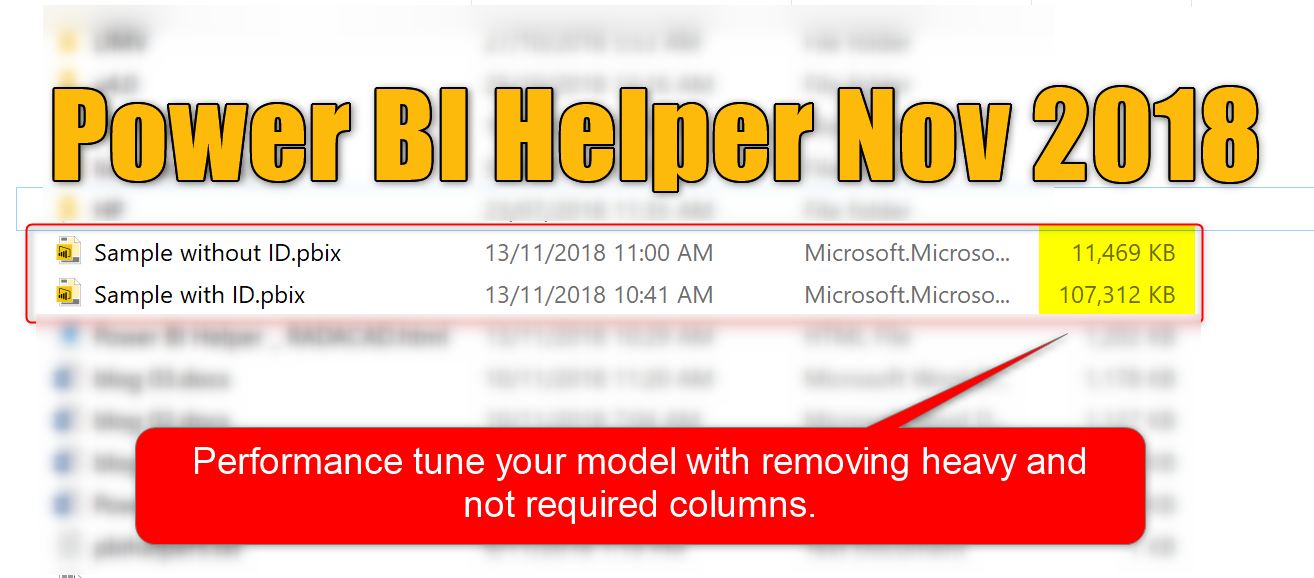
Report Page Tooltip – Revolution in Visualization of Power BI

Very exciting feature that is added in the most recent version of Power BI Desktop March 2018 is Report Page Tooltips. This is a specific type of tooltip which can be a report itself. which this feature you can have your drill down report designed separately, and then with hovering on a chart, you can Read more about Report Page Tooltip – Revolution in Visualization of Power BI[…]

Decision Tree: Power BI- Part 2

In the last Part, I have talked about the main concepts behind the Decision Tree. In this post, I will show how to use decision tree component in Power BI with the aim of Predictive analysis in the report. in next post, I will explain how to fetch the data in Power Query to get a dynamic Read more about Decision Tree: Power BI- Part 2[…]

Ribbon Chart is the Next Generation of Stacked Column Chart

Earlier this month (September 2017), in the new version of Power BI Desktop, a new type of chart announced; Ribbon Chart. The very first look and feel of this chart are similar to Stacked Column Chart. The question that might come into your mind is that; why another way of showing the same thing? The Read more about Ribbon Chart is the Next Generation of Stacked Column Chart[…]

Infographic Designer: Not Just Another Visual

At the time of writing this post; there are already more than 97 custom visuals posted in Office Store. The list includes many interesting custom visuals. However, Infographic Designer is one of the visuals that is not just another visual. This custom visual has some unique features that you cannot see in many other visuals. Read more about Infographic Designer: Not Just Another Visual[…]

Table with Embedded Chart in Power BI using R

Visualization is any kind of graphical representation that enable us to: Exploration, it help us to get more deep insight through huge amount of data Discovery, It also gives extra vision Analysis, it can be used to find pattern Communication, visualization help us to communicate better A few years ago Dr. Andrew Abela published a good Read more about Table with Embedded Chart in Power BI using R[…]

Interactive Charts using R and Power BI: Create Custom Visual Part 1

I am so excited about using Plotly packages in Power BI. So What is Plotly: is an R package for creating interactive web-based graphs via the open source JavaScript graphing library: https://plot.ly/r/getting-started/ this feature has been added recently and had been announce by Christian Christian Berg in Data insight summit 2017. I started to search about Read more about Interactive Charts using R and Power BI: Create Custom Visual Part 1[…]

ArcGIS Map in Power BI; Simple, But Insightful

I have written about 4 other types of map visual with Power BI before. In this post I want to explain how ArcGIS visual work as a map visual. There are some specific features in this visual which is simple to use, but will give you a lot of insight. With this type of map Read more about ArcGIS Map in Power BI; Simple, But Insightful[…]

Have more Charts by writing R codes inside Power BI: Part 3

In the previous parts (Part 1 and Part 2) , I have shown how to draw a chart in the power BI (Part 1) visualization. Also, in Part 2 I have shown how to present 5 different variables in just one single chart. In this post, I will show how to shows some sub plots in a Read more about Have more Charts by writing R codes inside Power BI: Part 3[…]

Have more Charts by writing R codes inside Power BI: Part 2

In the previous post (Part 1) I have explained how to write a simple scatter chart in the Power BI. Now in this post I am going to show how to present 5 different values in just one chart via writing R scripts. I will continue the codes that I wrote in the previous post  as below : Read more about Have more Charts by writing R codes inside Power BI: Part 2[…]

Have more Charts by writing R codes inside Power BI: Part 1

Power BI recently able users to embedded the R graphs in Power BI. There are some R visuals that it would be very nice to have them in Power BI. What is R ? Based on Wikipedia,  R is an open source programming language and software environment for statistical computing and graphics that is supported Read more about Have more Charts by writing R codes inside Power BI: Part 1[…]