
In the previous article, I explained how you can build a data model for budget vs. actual, where the grain of the two fact tables is different. The model works perfectly as a star schema. As long as you slice and dice data in the level of granularity that both tables support, then you don’t need anything else. However, if you want to go to lower grain than what the table supports, then you would need more calculations, and DAX can handle that easily. In this article, I’m going to explain some calculations using DAX that helps to go to a lower grain that what the fact table supports. To learn more about Power BI, read Power BI book from Rookie to Rock Star.
Prerequisite
I explained in this article, how to build a Budget vs. Actual Zero Complexity data model in Power BI.
There is no prerequisite for this article. However, I highly recommend you to read below articles beforehand;
- What is the Relationship in Power BI?
- What is the Cardinality of the Relationship?
- What is the Direction of the Relationship?
- Data preparation; First and Foremost Important task
- What is a Dimension table and why say No to a single big table
- Basics of Modeling in Power BI: Fact Tables
- Combining Dimension Tables in Power BI using Power Query; Foundation of Modeling in Power BI
- Star Schema and How to Build It
- Creating a Shared Dimension Using Power Query and Power BI
- Build Your First Star Schema Model in Action
- Budget vs. Actual: Zero Complexity model in Power BI
Sample Dataset
The sample dataset used here is the AdventureWorksDW Excel file which can be downloaded from here.
The Model
The model that we build for this sample in the previous article is as below:
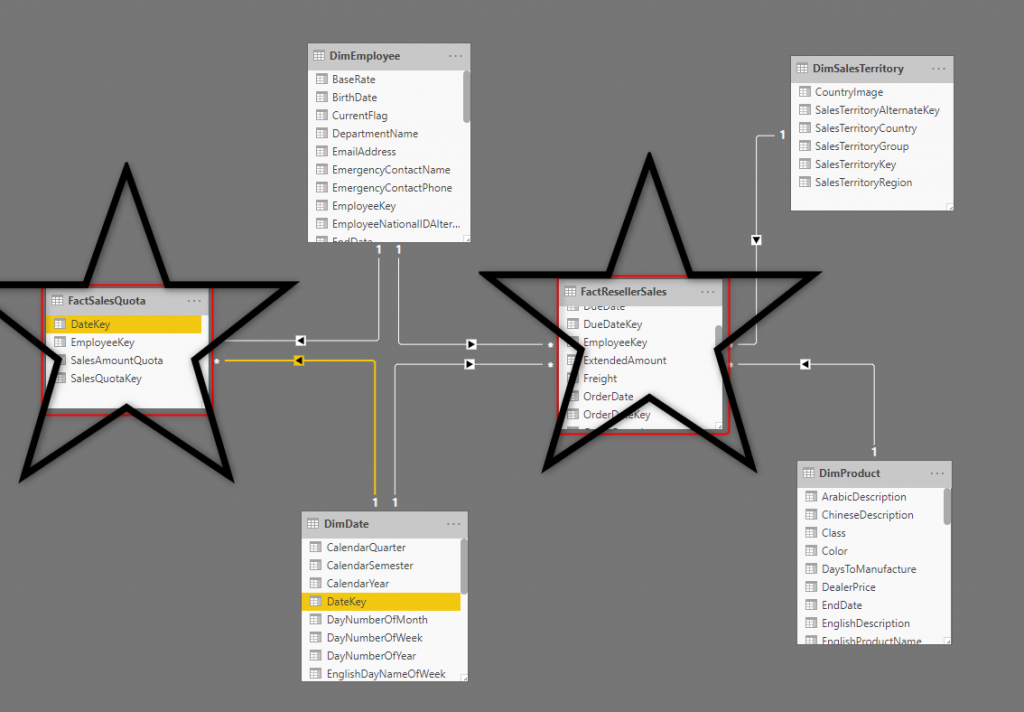
In the data model above, we have two fact tables;
- FactResellerSales which is on a grain of every DAY, every product, SalesTerritory, and Employee.
- FactSalesQuota which is on a grain of every QUARTER, and Employee
To connect both tables to the same Date dimension, we considered the first day of every quarter as the Date field for the FactSalesQuota, and then connected them through a star schema approach.
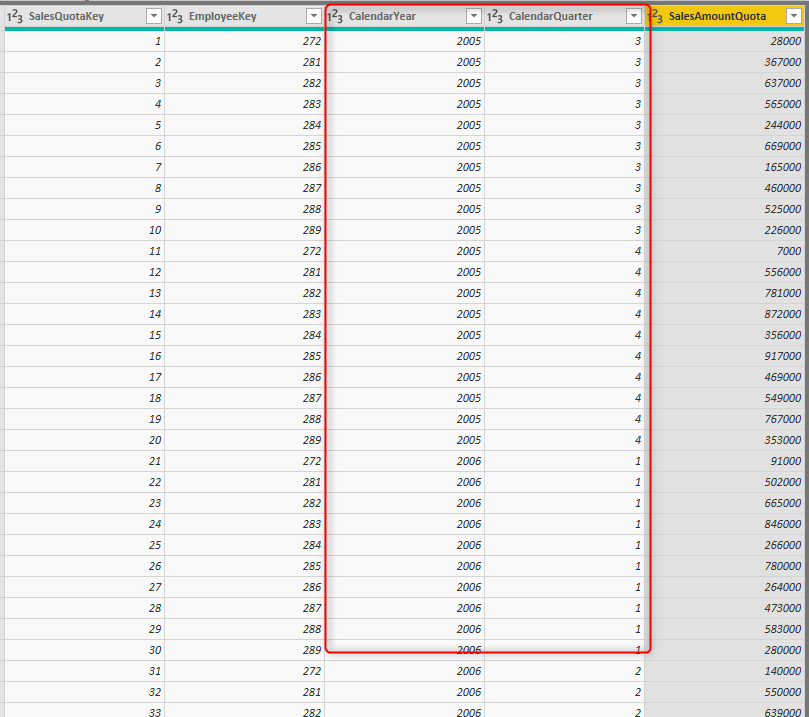
Here is how the data in the Sales Quota table looks like: (FactSalesQuota in the AdventureWorksDW)
Lower Granularity Problem
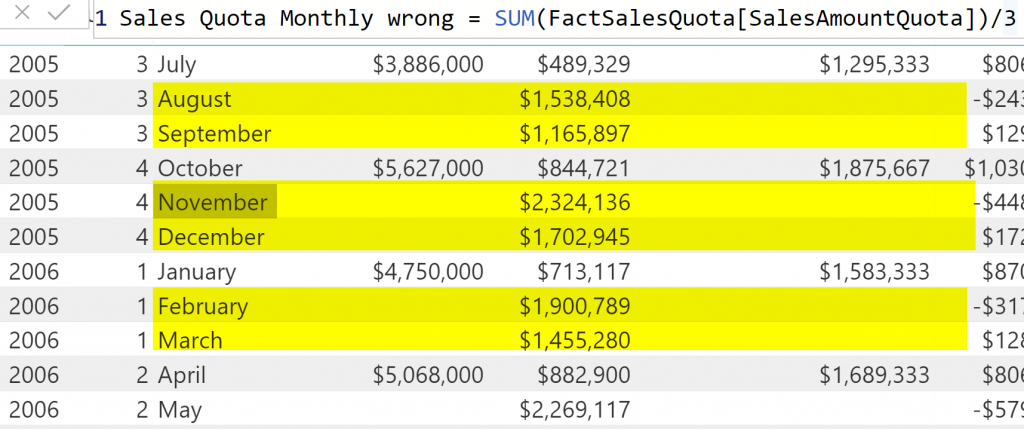
The schema above works perfectly if you slice and dice data by the grain supported by the budget table (or let’s say FactSalesQuota table) which is Quarter in this example. However, if you start analyzing data on a lower grain, for example, Month, you get something like this:
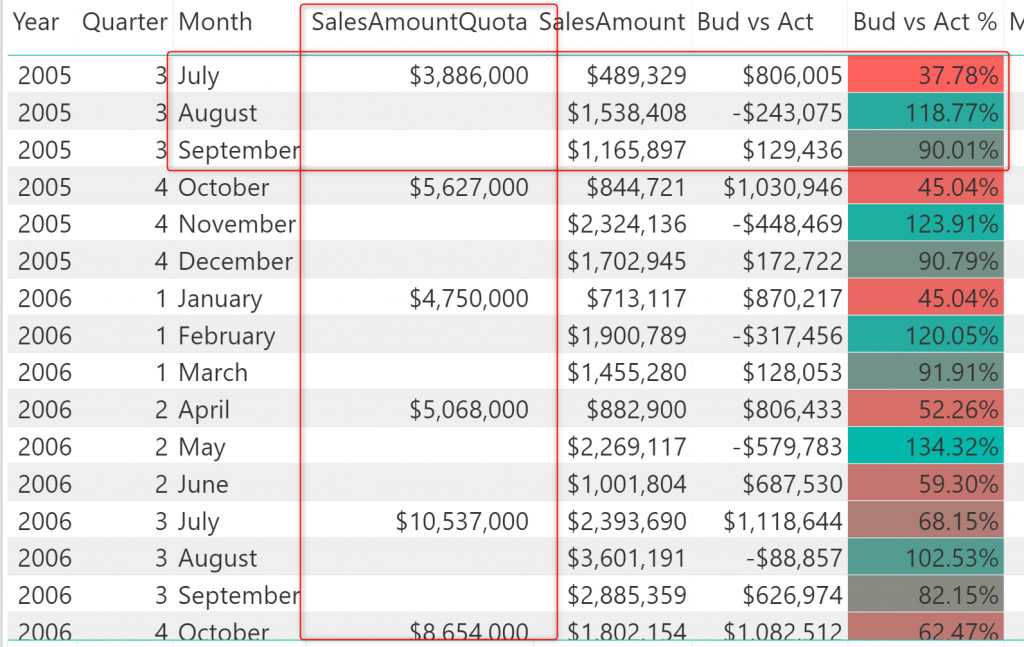
As you can see the FactSalesQuota only have values in the first month of each quarter. In a monthly analysis of the data, the FactResellerSales has values for each month, but because the other table doesn’t, then the calculation of budget vs. actual would be wrong in every month, for the first month, the budget value is so high (because it is for 3 months), and for the other two months is blank.
The important note here is that the budget data is only valid down to quarter level. Because there is no monthly budget, so the monthly analysis of that doesn’t make sense. However, sometimes, the requirement is, to calculate the budget split of the quarterly budget into monthly, weekly, or even daily. And that is what we are going to explore in this article.
Calculate Monthly from the Quarterly
The monthly calculation seems to be simple, each quarter will be three months in total, so the calculation of that would be the quarterly value divided by three. However, the problem is that when you go to the monthly level of slicing and dicing, then for some months, there is no value!
You should use some of the DAX techniques to overcome the issue. The issue is that in a given month, there might be no SalesQuota. Let’s go through an example: for August 2005: there is no SalesQuota for this month because the SalesQuota is for the 1st of July 2005. So, your job, in the DAX calculation, is to get the first quarter of each month (if your budget data is monthly, then you should get the first of each month instead). and then get the SalesQuota of that date.
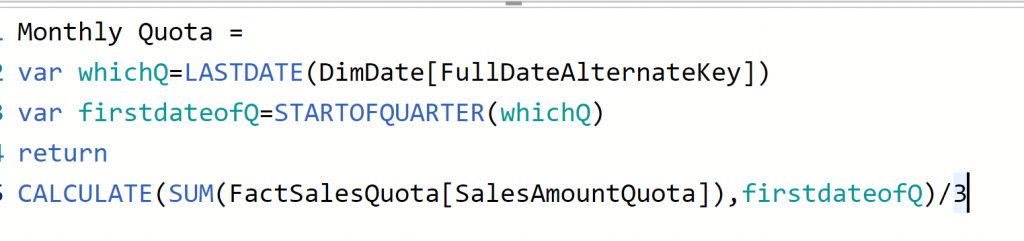
I used LASTDATE function to find out the current date in the visual’s row, and then STARTOFQUARTER function to fetch the start of that quarter. Finally, I wrapped it all inside a CALCULATE function to get the SalesQuota for the first of the quarter and then divided it by three to get the monthly Sales Quota. Here is the calculation:
Monthly Quota =
var whichQ=LASTDATE(DimDate[FullDateAlternateKey])
var firstdateofQ=STARTOFQUARTER(whichQ)
return
CALCULATE(SUM(FactSalesQuota[SalesAmountQuota]),firstdateofQ)/3
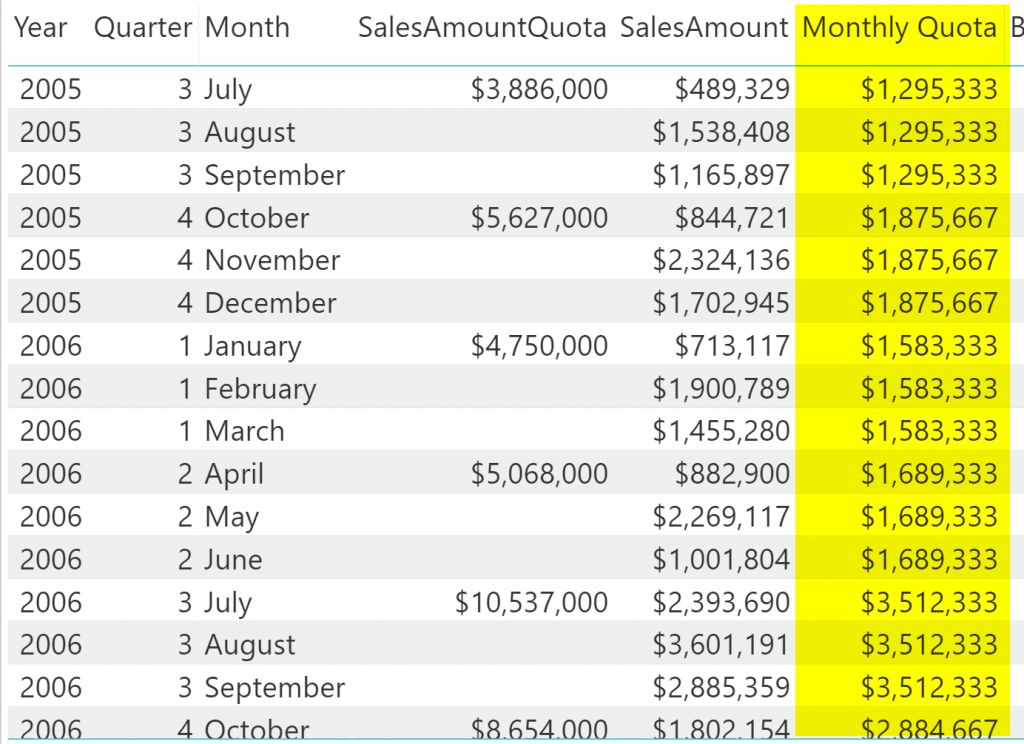
Now, here is the monthly quota working perfectly:
Calculate Daily from the Quarterly
If you go one level more down to the daily level, Same rules apply, However, this time you need to get an actual count of days in the quarter, because some months have 30 days, some 31, and some even 28! An easy approach would be that, we calculated the monthly, now let’s see how many days we got in each month. Well, that won’t be exactly correct. The best would be finding out how many days you get in the period, this way, if you have a month with a few days in it, still your calculation is spot on.
So, we need to calculate the number of days in each quarter.
Days in Quarter
There are many ways to calculate this, but since, we already have the start of the quarter, then it is as easy as using also ENDOFQUARTER and then DATEDIFF. (Or you can use DatesInPeriod, and then CountRows, or many other alternative ways);
Daily Quota =
var whichQ=LASTDATE(DimDate[FullDateAlternateKey])
var firstdateofQ=STARTOFQUARTER(whichQ)
var enddateofQ=ENDOFQUARTER(whichQ)
var daysinQ=DATEDIFF(firstdateofQ,enddateofQ,DAY)+1
return
CALCULATE(SUM(FactSalesQuota[SalesAmountQuota]),firstdateofQ)/daysinQ
When you calculated the days count in each quarter, then the rest would be dividing the Quarterly data by the count of days in the quarter as in the above expression.
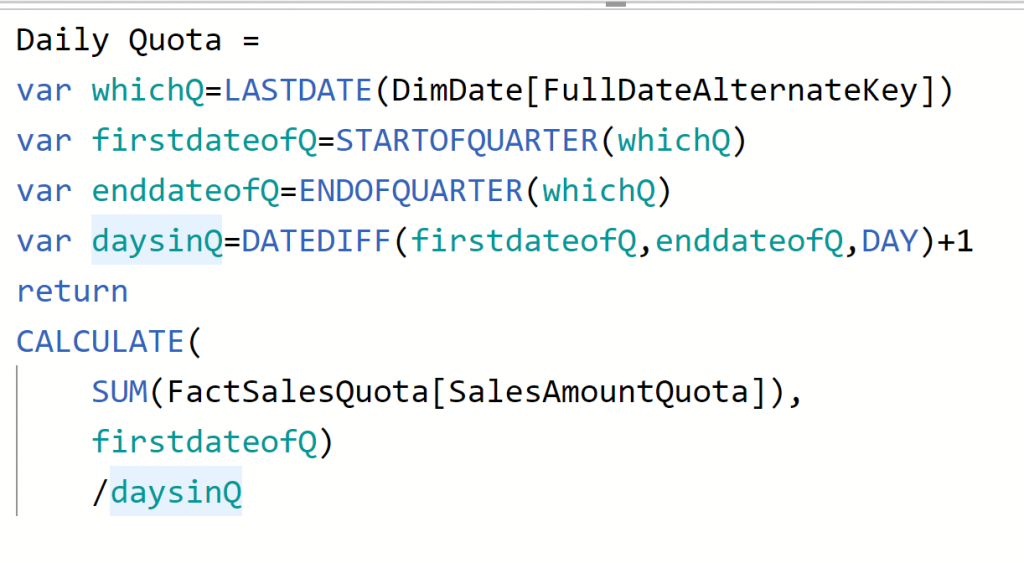
The plus one for the DateDiff calculation is because the datediff only calculate the difference, not counting one of the days. Here is the result:
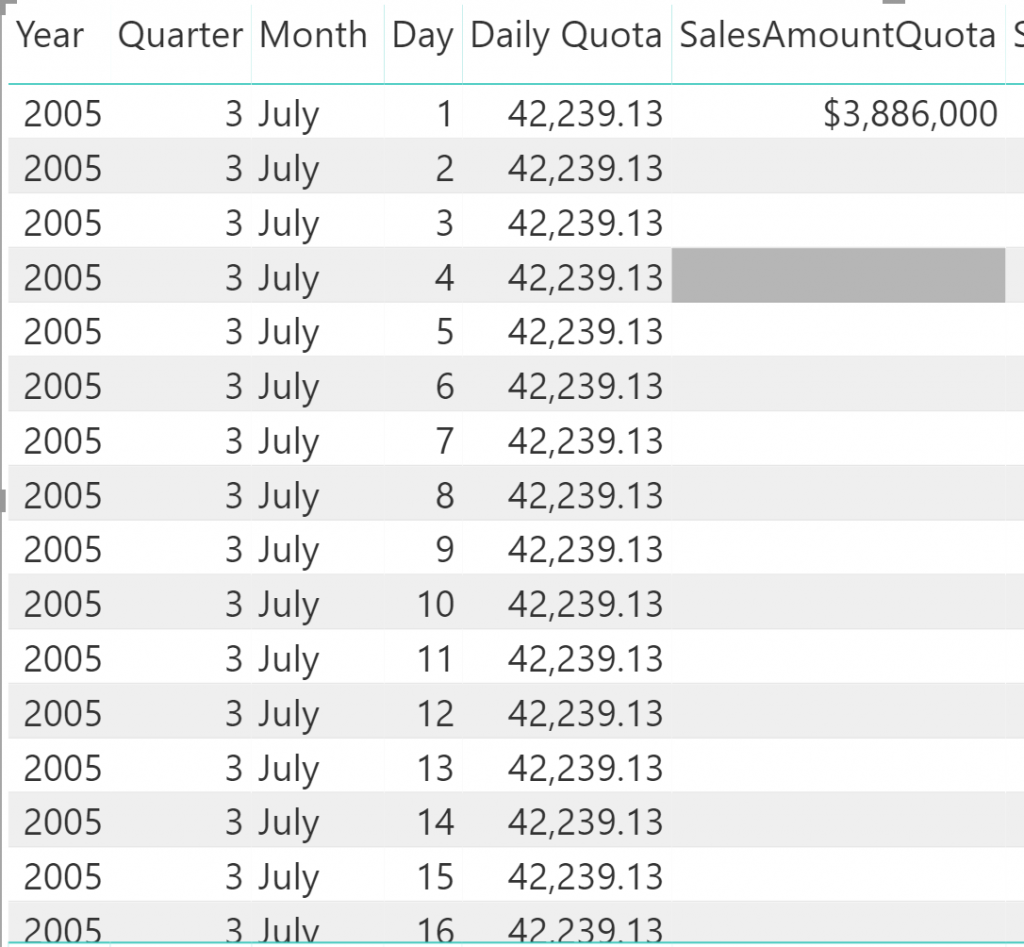
If you are doing this calculation for the sample dataset that I use here, then you might see that the actual values (FactResellerSales) are not on the daily level itself. You usually apply this calculation when your actual is in that level of granularity. Here, I just bring these calculations to cater for further needs.
Calculate Weekly
Calculating weekly values would be simple now that you have daily values. it would be the daily values multiplied by seven.
Calculate Custom Period
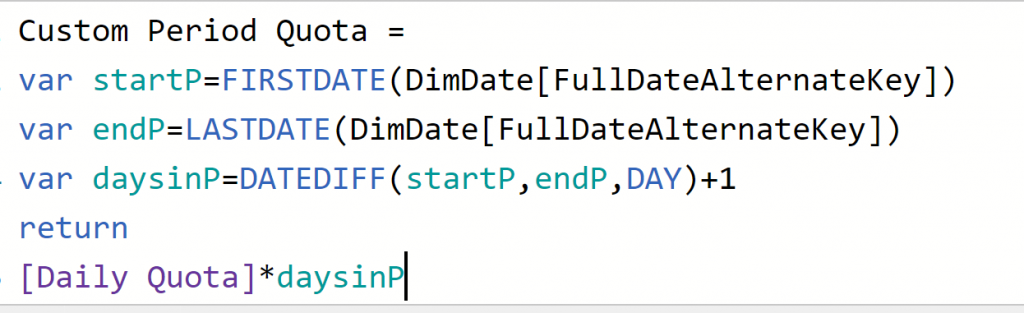
The custom period calculation can be counting days in the custom period and then multiplying the daily calculation by that number of days. Here is an example:
Custom Period Quota =
var startP=FIRSTDATE(DimDate[FullDateAlternateKey])
var endP=LASTDATE(DimDate[FullDateAlternateKey])
var daysinP=DATEDIFF(startP,endP,DAY)+1
return
[Daily Quota]*daysinP
One Calculation for them all
As you see, you can write any types of calculation you want. However, the problem would then be, that for every level, then you need to choose a different measure in the visual to see the correct output. You can use functions such as ISFILTERED to find out the level of slicing and dicing in the visual, and then run the proper calculation for that. This would be what I explain in the next article.
Summary
Even if your budget data is at a quarterly level, you can use DAX calculations to calculate monthly, daily, weekly, or even a custom period. In this article, you learned some methods using DAX expressions to overcome the requirement mentioned. In the next article of this series, I will explain how you can use ISFILTERED function in DAX to make them all dynamic through one single measure.
Is there a requirement in your budget vs. actual, that you can’t think of a solution for it? let me know in the comments below.
Also, I highly recommend you to read below articles beforehand;
- What is the Relationship in Power BI?
- What is the Cardinality of the Relationship?
- What is the Direction of the Relationship?
- Data preparation; First and Foremost Important task
- What is a Dimension table and why say No to a single big table
- Basics of Modeling in Power BI: Fact Tables
- Combining Dimension Tables in Power BI using Power Query; Foundation of Modeling in Power BI
- Star Schema and How to Build It
- Creating a Shared Dimension Using Power Query and Power BI
- Build Your First Star Schema Model in Action
- Budget vs. Actual: Zero Complexity model in Power BI


Reza is author of more than 14 books on Microsoft Business Intelligence, most of these books are published under Power BI category. Among these are books such as Power BI DAX Simplified, Pro Power BI Architecture, Power BI from Rookie to Rock Star, Power Query books series, Row-Level Security in Power BI and etc.
He is an International Speaker in Microsoft Ignite, Microsoft Business Applications Summit, Data Insight Summit, PASS Summit, SQL Saturday and SQL user groups. And He is a Microsoft Certified Trainer.
Reza’s passion is to help you find the best data solution, he is Data enthusiast.
His articles on different aspects of technologies, especially on MS BI, can be found on his blog: https://radacad.com/blog.
Fantastic article
thanks, Reza
I need to present budget vs actual in this format by
1Q, 2Q, 1H, 3Q, 4Q and Full Year.
Wondering how to go about doing it. Appreciate your advice. Thanks.
1Q 2Q 1H 3Q 4Q Full Year
Budget Actual Balance Budget Actual Balance Budget Actual Balance Budget Actual Balance Budget Actual Balance Budget Actual Balance
MEDICAL GENERAL
DENTAL GENERAL
STAFF WELFARE
TRAINING EXP
RENTAL OF VEHICLE – GENERAL
AUDIT FEES
SECRETARIAL FEE 300 250 -50 460 330 -130 760 580 -180 460 330 -130 380 0 0 1600 910 -310
Hi Grace
You do need to have Quarter and Half Year and Year columns in your date table, then if the budget is at quarter level, when you look at it in the higher levels which is half-year or Year, it will automatically roll up values.
Cheers
Reza